

Before the overflight
The Portuguese cartographers of the fifteenth century held the most valuable commercial intelligence in Europe — accurate maps of the West African coast, the Indian Ocean trade routes, and the spice islands of Southeast Asia. Intelligence built on a specific and unassailable advantage: their charts could not be reproduced. Not because they were secret, though the state tried its best to keep them that way. But because the production process — the accumulated voyages, the triangulated coastlines, the generations of navigational knowledge embedded in each successive revision — was irreproducible by any competitor who had not made those same voyages, with the latest instruments, ships and a dose of courage. There was no shortcut. No competitor could derive the coastline from theory or reconstruct it from secondary sources. You had to be physically present — at cost, at risk, over time. The map was the condensed output of a physical, capital-intensive, irreversible process. The moat was the production barrier, and the production barrier was the geography itself.
For roughly five centuries, successive technological waves improved the cartographer’s capabilities without altering this economic relationship. The printing press enabled mass reproduction. Copper engraving improved fidelity. Triangulation improved accuracy. The chronometer solved the longitude problem. Each enhanced the cartographer. None removed the need to go there.
Then satellite imagery arrived. The structural break was not that satellite imagery was more accurate than ground-based observation. The break was that it bypassed the existing observational process entirely. In a single overflight, a satellite could capture more precise geographic information than a century of maritime surveying had assembled. Voyages were now unnecessary. The cartographer’s core competitive advantage was obsolete.
Value was forced to migrate away from the commoditised informational product — accurate geography. Every nation, every agency, every private firm could license a satellite feed to produce accurate maps of any place on Earth, with resolution and precision that ground survey could never match. What remained scarce was a separate tier of information that accurate geography could not capture. Value shifted from maps to cadastral records, geological surveys, zoning classifications, and official land registries.
Cadastral records1 — the legal document defining property boundaries — survived because their value was never in the accuracy of the boundary line. It was in the legal authority of the determination: surveyed by a licensed professional, recorded by a government authority, and carrying legal force in a dispute. Similarly, a geological survey established the official account of what lay beneath a given surface and determined what could be extracted from it, built upon it, or assessed for environmental and structural risk. A zoning classification captured the regulatory ruling on what is legally permissible on a given parcel. These records carried a different kind of payload entirely — legal authority, state-sanctioned certification, regulatory standing. One that satellite imagery could not produce, regardless of its resolution. A more precise map of a plot of land does not constitute a title deed. One tells you where things are. The other determines what may be done with them.

As geographic data (the base layer) became more precise, the legal and regulatory records (the authoritative layer) gained resolution and meaning: property boundaries could be drawn exactly, mineral rights mapped more precisely, and permitted uses more clearly bounded against a more accurate surface. The improvement simultaneously commoditised the base layer and raised the value of the authoritative layer anchored to it. The cartographer’s successor wasn’t a better cartographer. It was someone who understood that when the base layer’s production barriers collapse, what remains scarce is what the base layer cannot settle on its own.
This is the distinction that runs through the financial data industry. But before we unpack how, some context.
Author’s Notes
This deep-dive builds directly on the value chain framework established in the Smiling Curve — the three-stage model of Production, Distribution, and Activation that structures this analysis throughout. If you’re new to the series, reading that post first will give you the anchor points this argument assumes.
This post continues the series in unpacking the financial data stack. It occasionally draws on ideas we’ve covered in Bloomberg’s dominance, the three economic models of data, the industry’s prime mover, as well as what comes after the terminal. LSEG’s meanderings provide a glimpse of Distribution’s ongoing challenge.
Named companies are representative incumbents in their value chain positions. The analysis focuses on structural dynamics rather than individual company theses and should not be construed as investment advice.
The analysis is structured into four acts, the first three addressing the data, process and workflow layers each, with the final act providing proof of the collective argument.
The findings are designed to serve you wherever you sit in this industry. Builders and their backers can identify where the moats are thinnest. Investors are invited to challenge the consensus. Operators inside the stack are given the frameworks and scaffolding for what is happening around them but havn’t been labelled. The aim is for you all to walk away with conviction and enthusiasm to compete, innovate, and disrupt.
Act 1 — The Data Defence
The water, not the pipe
Day Ralio’s fixed-income fund has been leading peers. She opens her LSEG Workspace for a routine portfolio book review.
The corporate bond positions appear first — price, yield, option-adjusted spread, each figure transmitted since the last trade. The values she retrieves are market observations, facts captured at the point of transaction and transmitted with integrity from the liquidity venue (outside the terminal) to every endpoint receiving the feed. Several positions have not traded recently. For those, the terminal constructs a valuation using one of many available methodologies applied to observed comparables licensed from multiple third parties, generating an approximate, best-guess price where no recent transaction exists. She notes the distinction between actual and calculated prices and moves on.
A portfolio-monitoring alert lands in her inbox. The fund is 30 basis points overweight in BBB-rated financials relative to the Bloomberg US Aggregate Bond Index, the benchmark she aims to outperform. It’s the mandate against which the investment committee evaluates performance, the board report is written, and to which every counterparty in the chain is anchored. One that a technically superior index cannot replace with finer inclusion filters, a more rigorous illiquidity adjustment, or granular cashflow awareness. The coordination among market participants and decision-makers was established long before this terminal session. It passes through unchanged.
The alert warrants a compliance check. The mandate requires investment-grade only, and with the credit cycle turning, Ralio wants to identify BBB-rated holdings at risk of crossing the threshold. The systematic review covers fundamentals, coverage ratios, sector exposure, and issuer trends. A subset of names emerges as candidates for potential derating. She trims or exits those positions within the mandate’s permitted range, acting on her internal analysis. Then Moody’s acts. Across the sector, a wave of cuts. Some aligned with what she had already moved out of, others with names she had not flagged. For the latter, the mandate is unambiguous: investment grade only. Those positions must be sold. Her review was an exercise of analytical judgment; the forced sales were a matter of regulatory designation.
The forced sales go to market. The cut to sub-investment-grade draws out multiple mandate-constrained sellers, all moving simultaneously. Natural buyers are scarce. The prices achieved are substantially below the evaluated pricing2 the fund had been carrying for those positions. The fund’s reported portfolio value, client communications, and regulatory filings all take a hit. The regulator examines the gap. The fund’s internal records carry positions at the calculated price. The FINRA TRACE3 reports, filed by the executing brokers within 15 minutes of each transaction under regulatory obligation, document the authoritative price at which the bonds actually cleared. The fund’s book value was never construed as a market price. No refinement of the evaluated methodology could make it a licensed witness to the transaction.
Ralio, disappointed to be caught in the reflexive trade, turns off her terminal, wondering what she could have done to better anticipate the next downgrade review. Could she find an alternative benchmark that didn’t skew as much towards financials? Or a ratings agency that was easier to predict ahead of a credit review?
Utility and payloads
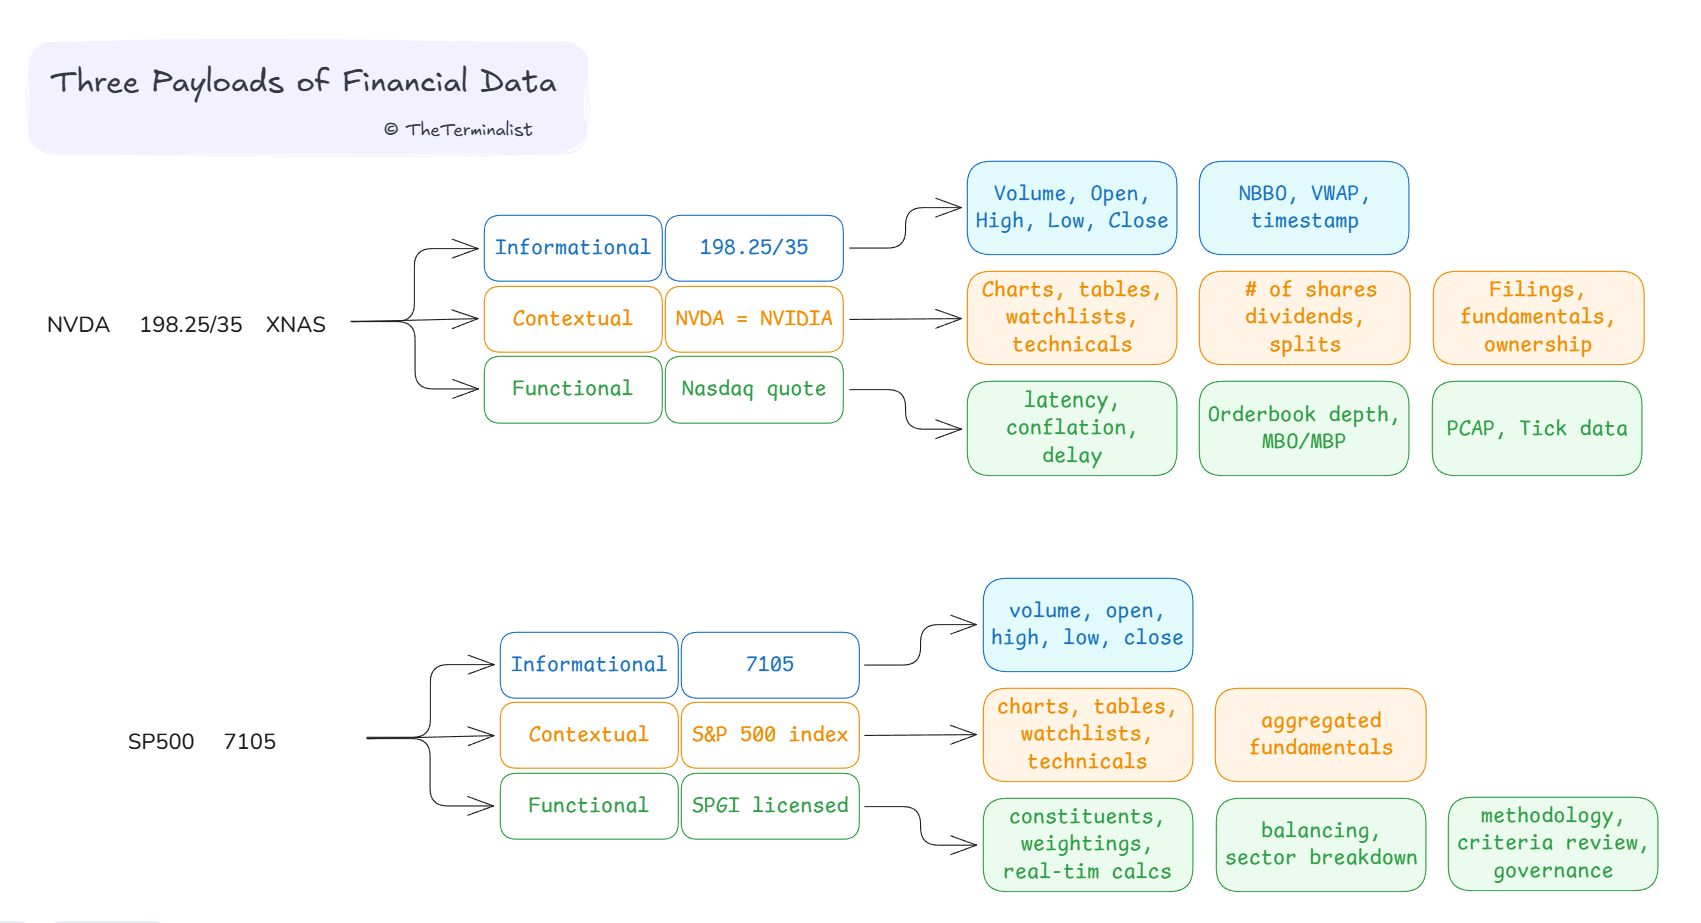
The market price. The index composition. The rating outcome. The TRACE ledger value. These are the payloads Ralio reached for. The terminal was present throughout, but what it contributed was invisible and hard to name. Invisible to Ralio, who, despite paying for the terminal, reached for assets the terminal doesn’t really own. She isn’t alone. Buyers of financial data rarely pay for the terminal. They pay for the utility that the data payload delivers at the point of consumption. Utility similar to what we saw with cartography. In financial data, that utility falls across three distinct tiers.
Informational payload — these are facts about the state of the world: price, coupon, spread, volume, and fundamental metrics captured at source. The primary universal utility is accuracy — knowing what is or was. The payload cannot be altered; any modification beyond faithful transmission violates the data. In addition to accuracy, other attributes are valued depending on the usecase - latency, update frequency, granularity, etc. Distribution’s role with informational payloads is to convey them with integrity. Delivering that integrity at an institutional scale across a wide range of data types requires a contextual layer operating beneath it.
Contextual payload — the enrichment that makes data usable at the point of consumption. This is what operated offstage during Ralio’s terminal session. Concordance infrastructure4 that resolves the same bond correctly, whether it arrives from a transaction feed, a custodian file, or a counterparty report; normalisation engines that make revenue mean the same thing, whether the filing follows GAAP in New York, IFRS in Frankfurt, or a local regime in Seoul. Further downstream, other processes distil aggregated inputs into structured analytical outputs: evaluated pricing that assigns a mark to an instrument that hasn’t traded lately; consensus estimates that compress a dozen sell-side submissions into a single figure. Contextual payloads are by design the only tier that can be enriched in transit. A concordance table is built, not transmitted. An evaluated price is constructed, not captured. A consensus estimate is synthesised, not observed. This is where Distribution adds value.
Functional payload — what data does beyond informing: it coordinates behaviour, certifies standing, and records transactions. The functional payload is the financial data equivalent of the cadastral register — not a description of what the world is, but a determination of what may be done with it. These payloads are established at source by the entity whose authoritative position confers the protection, and pass through the chain immutably. The Bloomberg US Aggregate Bond Index’s coordination function was established when the mandate first named it, not by any terminal that delivers it. A Moody’s rating carries certification because the regulation designates it as competent to certify. The TRACE tape’s provenance comes from the execution infrastructure authorised to record it. In each case, the structural position that confers value sits upstream of Distribution, and nothing can migrate it downstream.
In practice, these three payloads travel together. As with Day’s terminal session, most participants receive them bundled onto one surface. Delineating their value-creation and value-capture mechanisms establishes their vulnerability.
Contextually trapped
For the informational tier, value creation is measurable and commonly agreed upon. Accuracy, latency, coverage, granularity, and other technically defined attributes. A challenger that achieves technical and performance parity on service and quality specifications at a lower cost has the right to displace the incumbent. No structural protection stands behind an accurate price feed in isolation. The moment a cheaper source achieves parity, the informational payload has been matched. Value capture lies in pushing the measurable attributes further in degree and at lower cost: lower latency at higher granularity, control and throughput5.
The functional tier is not a matter of degree. Value creation resides in the physical, legal and social fabric of financial markets. A benchmark provides a common, independent, deterministic yardstick. The process is codified, and once codified, no subjective judgment enters the output. That neutrality is what makes it a trustworthy coordination mechanism. A credit rating is valued for being commonly applied, independent, and deterministic in its process, but it adds an extra step. Analyst judgment is part of the process but is tightly governed, earning a regulatory designation that imposes financial obligations on systemically important actors. In addition to maintaining neutrality and fairness, an exchange or its OTC equivalent builds the physical, digital and legal infrastructure necessary to record prices. In all three instances, value creation is additive and well beyond technical means.
Value capture follows suit. The mandate either names the index or it does not. The rating is valid only if the regulator designates the agency as competent to certify. Only what is produced by the authorised infrastructure is considered a binding price. No amount of technical capability can cross these thresholds. A challenger can be analytically superior on every measurable dimension and still be structurally excluded from the value-capture mechanism.
The contextual tier sits between them. Value creation here is technical and operational. Concordance infrastructure, normalisation engines, evaluated pricing, consensus aggregation. All of it is built. Supported by an array of assets. Tables, procedures, schemas, methodologies, and decision logic. Each one iterated, codified, and operationalised for precise repetition at scale.
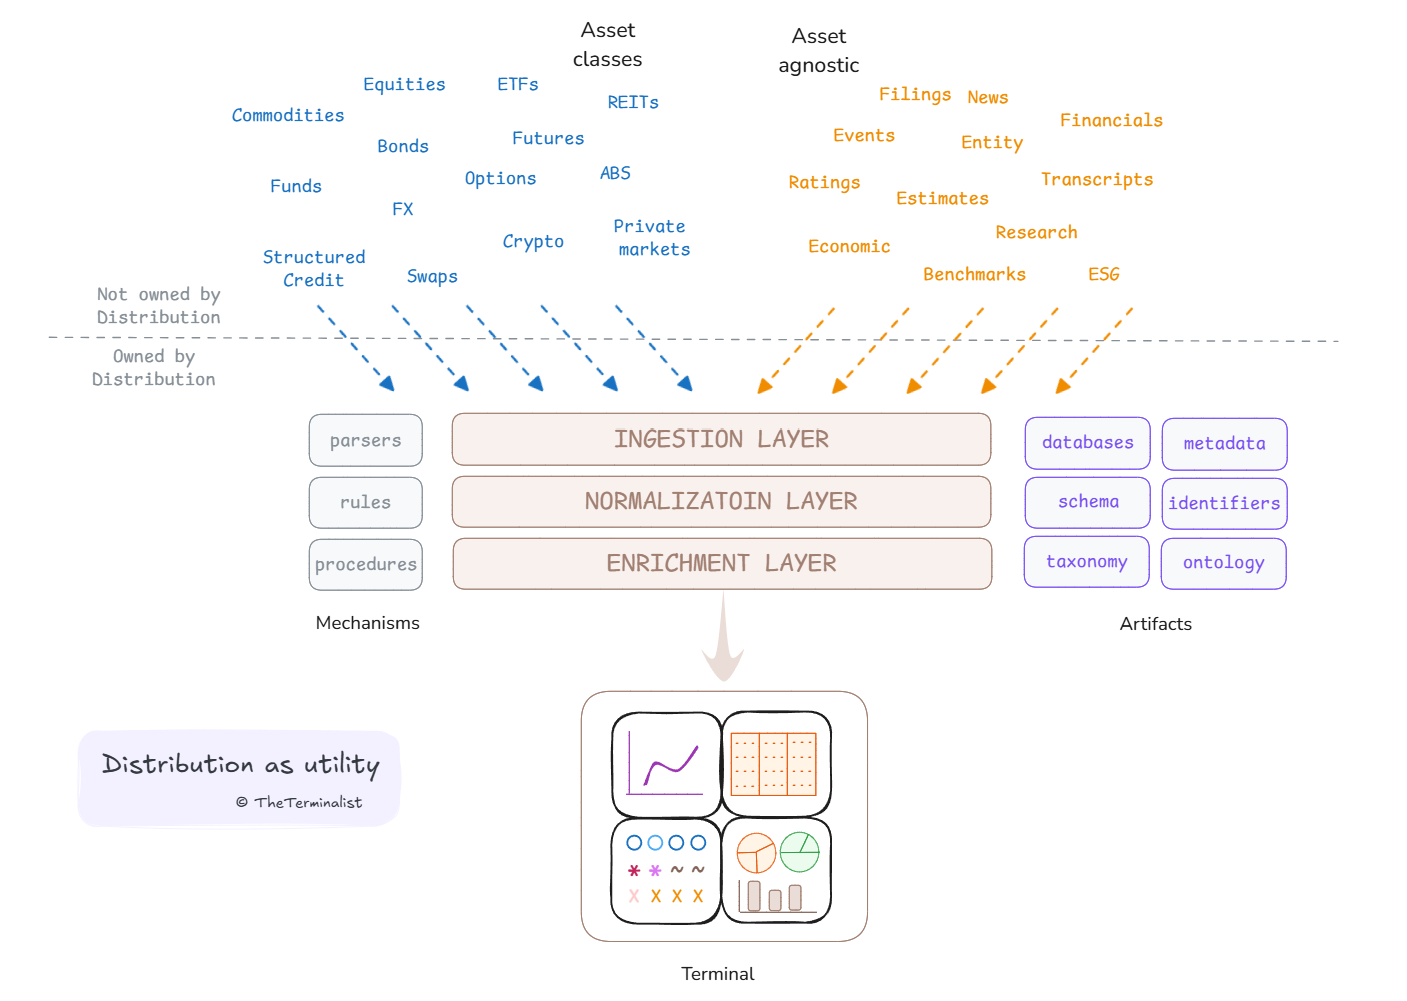
Value capture occurs through a bundle spanning homogeneous data and heterogeneous products, sold as a single commercial relationship and protected by the friction of disaggregating them. But contextual value does not accrue in isolation. It exists only in relation to the other two tiers. While the informational and functional tiers create value independently, the contextual tier cannot. Value creation is therefore co-dependent and capped. It cannot exceed the value of the tiers it connects.
The Smiling Curve illustrates this constraint both figuratively and financially. Value concentrates at the ends of the chain — at Production, where information-only payloads originate, and at Activation, where function-only payloads are established. The curve bends in the middle because the middle lacks structural defences. Distribution’s operating territory is reduced to the contextual tier, limiting value creation and capture. But what matters more is whether it is in decline.
The nature of that work determines its vulnerability. Every data processing task is a documented, legible, repeatable operation that applies defined procedures at scale. No coordination barrier stands behind a normalisation engine, nor a regulatory designation behind a concordance table. Work of that kind, without functional protection, relies on a distinct form of safety: completeness at scale. The depth of coverage, the years of accumulated edge-case resolution, and the breadth of source relationships built up over decades. As with cartography, protection comes from accumulated experience, trial and error, and the path dependence that shaped the contextual assets. A capital-intensive and time-consuming endeavour few challengers could sustain at scale.
Until the equivalent of satellite imagery arrived. The arrival of tooling that can achieve replicative parity by bypassing the production process opens Distribution’s terminal value to repricing. The question now becomes: does the contextual infrastructure that took decades to build take decades to challenge?
Act 2 — The Process Defence
Dismantled pipelines
Information that makes it to the map undergoes an arduous journey from observation to print.
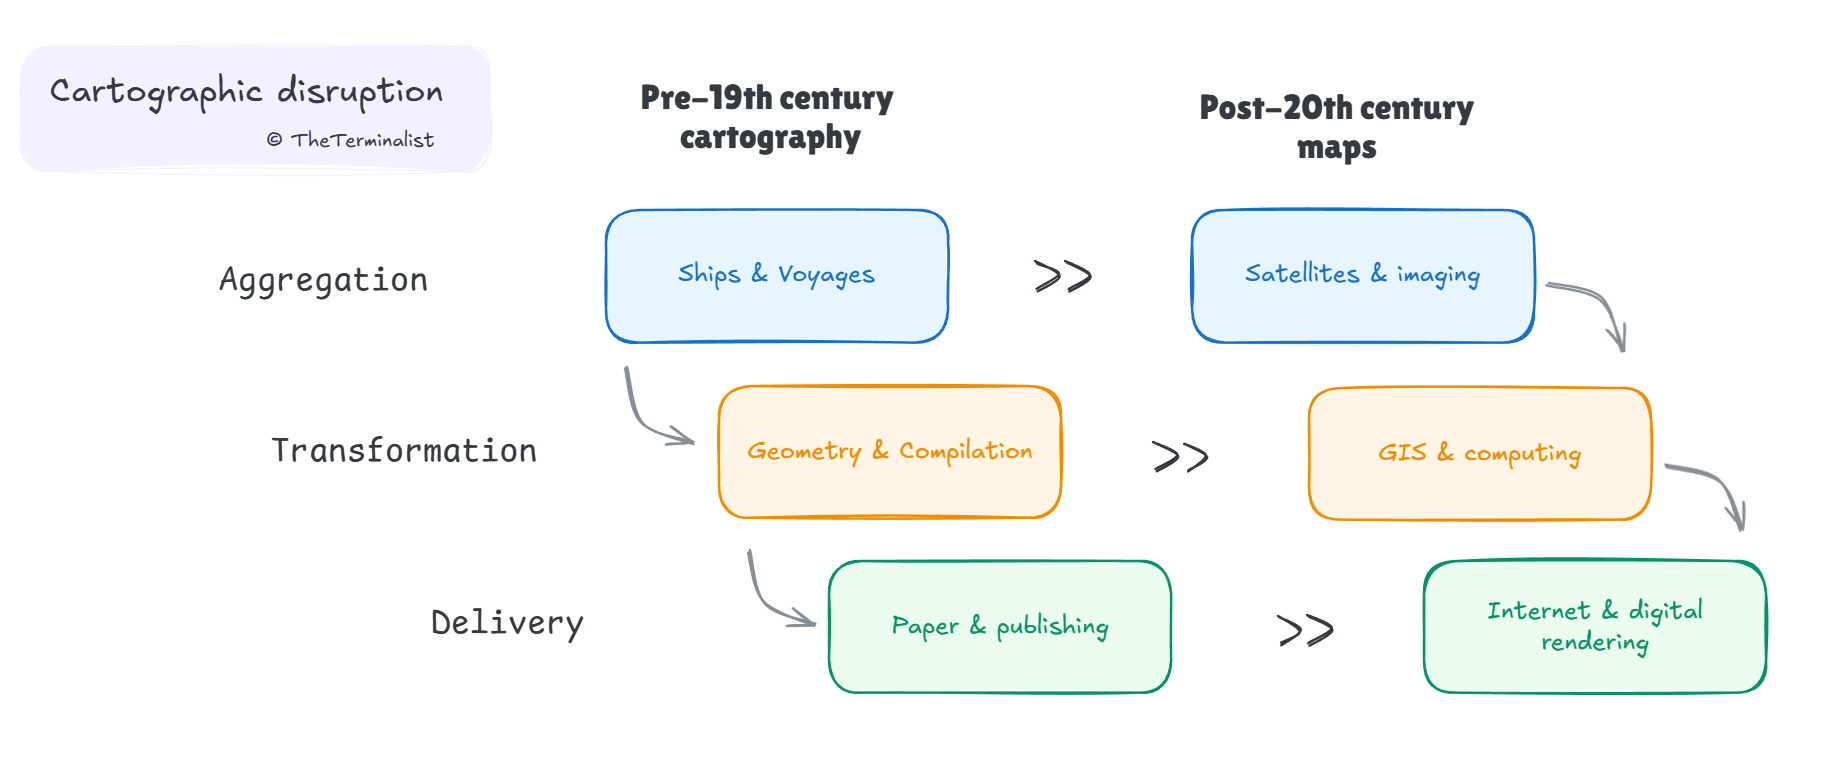
The first stage, Aggregation, encompassed everything that generated raw data. Triangulation networks across landmasses, coastal surveys from ship decks, depth soundings, and astronomical longitude fixes — all required physical presence for centuries. GPS and satellite imagery ended that requirement. GPS eliminated triangulation as a necessary process. Satellites eliminated the need for an observer on the ground. The constraint was removed, not improved.
Transformation, the second stage that converted raw observations into a usable manuscript through numerical reduction, compilation, and projection, was replaced by digital information systems (GIS). These didn’t improve the compilation room; they replaced the end product. Fixed, hand-drawn manuscripts became redundant against a dynamic, multi-scale, versionable, queryable geospatial database. But GIS required a precondition: upstream disruption had to happen first. Aggregation had to produce digital outputs that computer systems could ingest; field books and sketches would not do.
The final stage, Delivery, involved preparing, printing, and distributing the published map. It collapsed with the internet, driving the marginal cost of distribution towards zero. The traditional map publisher, the copper-plate maker, the atlas house: each was displaced not by a better version of what they did but by a delivery mechanism that made their function unnecessary.
In each case, new technology replaced the existing pipeline infrastructure, delivering a higher-quality outcome at a fraction of the ongoing cost. Importantly, disruption was stage-specific: aerial photography had no application in the compilation room; GIS had no application for terrain observation; the internet had no application for either. Moats were laddered sequentially. The disruption and rearchitecting of the entire pipeline took decades. The financial data stack offers no such refuge or time buffer.
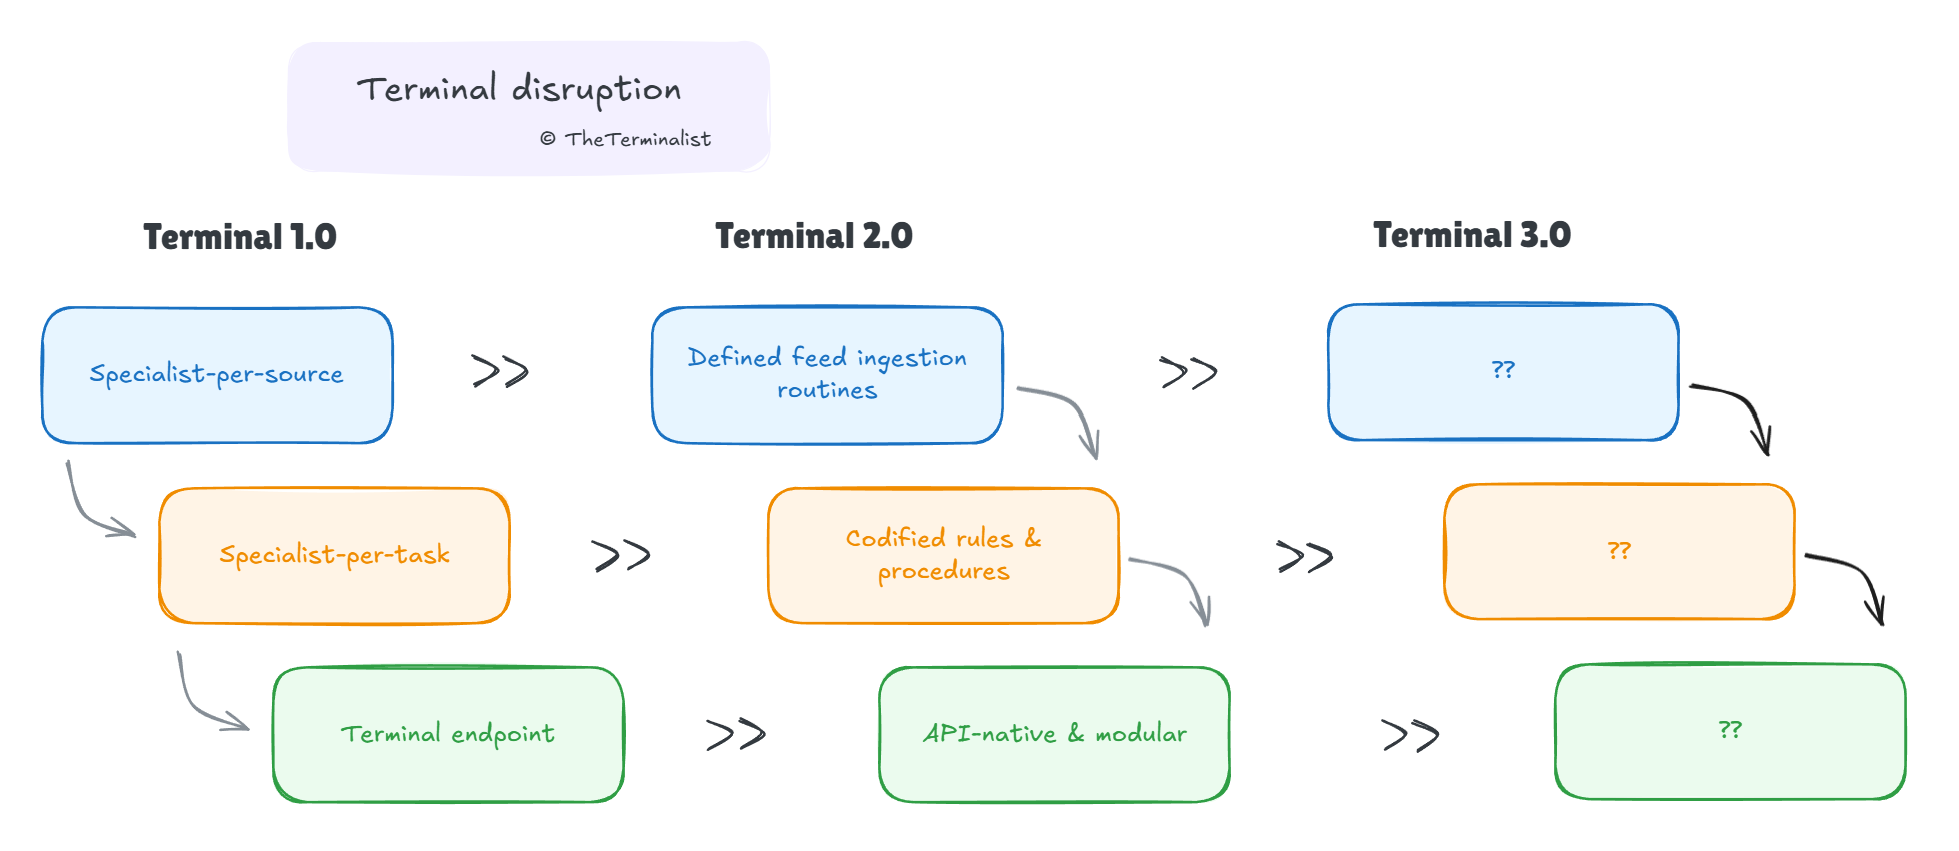
Specialist-per-source
Distribution’s aggregation layer spans hundreds of heterogeneous sources across exchanges that vary in protocol, issuers with their own reporting formats, and data categories with differing specifications and source-vendor conventions. The operational cost of maintaining the systems and workforce that normalise divergent inputs into a consistent, enterprise-grade feed was the historical aggregation moat.
Parsing an exchange feed was not the problem. Binary protocol handlers relied on deterministic methods. The cost lies in understanding it: what fields mean across incompatible exchange schemas, how fields map across formats that describe the same instrument differently, and how those mappings must adapt whenever a specification changes.
Corporate actions deepened the pattern. The difficulty was not in capturing the event announcement, but in reading legal text across jurisdictions, identifying the financial mechanics, and applying the correct adjustment to every affected time series. Edge cases consumed most of the expertise. Fixed income T&C added a non-overlapping register: legal text comprehension across prospectuses, indentures, and supplemental filings, which had to feed into the structured extraction of coupon, call provisions, and covenants. Funds and ETF data, FX flows, and commodity data each extended the same structure further. The domain knowledge required at each source boundary was wildly disparate.
Every source type demanded dedicated handling — a specialist who knew that exchange’s schema, that data category’s conventions, that jurisdiction’s legal format. The specialist-per-source model was how the industry scaled. The model carried two interlocking forms of protection. The first was operational: the headcount, expertise, and accumulated process knowledge required to build the pipeline. The second was sourcing the data itself. Proprietary feed agreements, exchange partnerships, licensed content relationships built over decades — access to the raw inputs that no challenger could replicate simply by hiring better engineers. The sourcing position was the foundation on which the specialist-per-source model stood.
Specialist-per-task
Transformation is where Distribution becomes a content business rather than a relay. While Aggregation handles the point where external feeds enter the pipeline, Transformation operates downstream on work defined by its output standard rather than by its input source.
Revenue normalisation requires mapping line items, reclassifying non-recurring items, and standardising segment structures across thousands of companies filing in dozens of formats. KPI extraction from earnings releases and investor presentations involves reading the same unstructured documents that analysts read, identifying performance metrics that are inconsistently labelled, and building structured time series that aggregate across companies and periods. Consensus estimate aggregation pulls in sell-side model submissions, resolves methodological inconsistencies across contributors, and produces aggregate views.
Each sub-process requires genuinely divergent, domain-specific expertise grounded in distinct knowledge bases. Entity disambiguation skills don’t apply to time-series error detection. Distribution’s organisational answer was a separate specialist team per task, each with its own training pipeline, quality standards, and career track. Where the aggregation layer demanded a specialist per source, the transformation layer demanded a specialist-per-task.
The historical protection of that model was not documentation — it was iterative learning without a compression shortcut. A KPI extraction team accumulated tacit expertise over years: which line items a given issuer uses inconsistently, which accounting elections recur across a sector, and which formats need what kinds of adjustments. That knowledge was encoded in team practice. There was no manual, because writing the manual was the job. Well-documented procedures were the model’s eventual outcome.
But the deeper protection was not the experts themselves. It was what they produced together at scale. Cross-source entity resolution, uniform corporate actions propagated across time series, reconciled outputs across source variance. These were not solved by any single team. They were solved by an integrated data operation coordinating dozens of specialist functions, built and calibrated over decades. The integration premium — the value of coherent, cross-vendor output that no challenger had yet assembled — was what protected the model.
A shrinking perimeter
Both defences rest on specific claims — one about the exclusivity of the raw material, the other about the irreplaceability of the coordination work that transforms it. The former is visible and the first to crack. The latter is where the industry’s confidence runs deepest, and its shift is what few are paying attention to.
The sourcing defence
The sourcing defence claims that superior pipeline capability is constrained when the raw materials are themselves exclusive. The claim rests on two assumptions: that the raw data challengers need remain scarce, and that Distribution’s sourcing position is stable. Neither holds.
The raw substrate is becoming more structured at the source. Regulatory mandates do part of the work: XBRL tagging of SEC financial statements provides structured data that Distribution’s teams once had to manually extract, arriving pre-tagged at source.6 TRACE and SFTR have moved historically opaque OTC transaction data into a structured, publicly accessible record. When bilateral and decentralised transactional activity routes through approved nodes, it becomes identifiable, better-defined, and eventually legible. Derivatives data via EMIR and CCP clearing, municipal bond issuance through EMMA. No regulator is mandating less structure7. The direction is one-way, and we are early in the wave of data standardisation for OTC instruments.
The identifier infrastructure is pushing openness in the same direction: FIGI, originally Bloomberg’s proprietary instrument identifier, is now freely accessible; GLEIF’s LEI system provides globally unique entity identification, mandated under EMIR and Dodd-Frank; consolidated tape regimes in the EU and UK establish mandatory, non-exclusive data access by regulatory design. The legibility and openness compound. More structured data lowers the barrier to regulators mandating open access, which drives more mandates for openness.
For highly standardised categories — equities, futures, treasuries, major corporates — the substrate threshold has been sufficiently crossed. A competitive tier of providers has built institutional-grade feeds on publicly accessible exchange infrastructure: Exegy, Polygon.io (now Massive), Intrinio, and Quodd (with Xignite) serve professional and institutional clients from the same exchange on which LSEG built its feed businesses. Services such as ViaNexus offer plug-and-play distribution capabilities, enabling data sources to distribute directly without an intermediary. Tradeweb, MarketAxess, and more recently Trumid have captured a meaningful share of fixed-income execution from Bloomberg and voice chat. In the lower-standardisation OTC categories, the three major interdealer brokers8 each operate independent data platforms, sourced directly from their own transaction flow, via Fenics, Parameta Solutions, and TraditionData. At the primary market end, Finsight, 9Fin, and Terrapin Finance, alongside a cluster of adjacent specialist providers, cover new-issue pricing and reference data for corporate credit, structured credit, and municipal bonds.
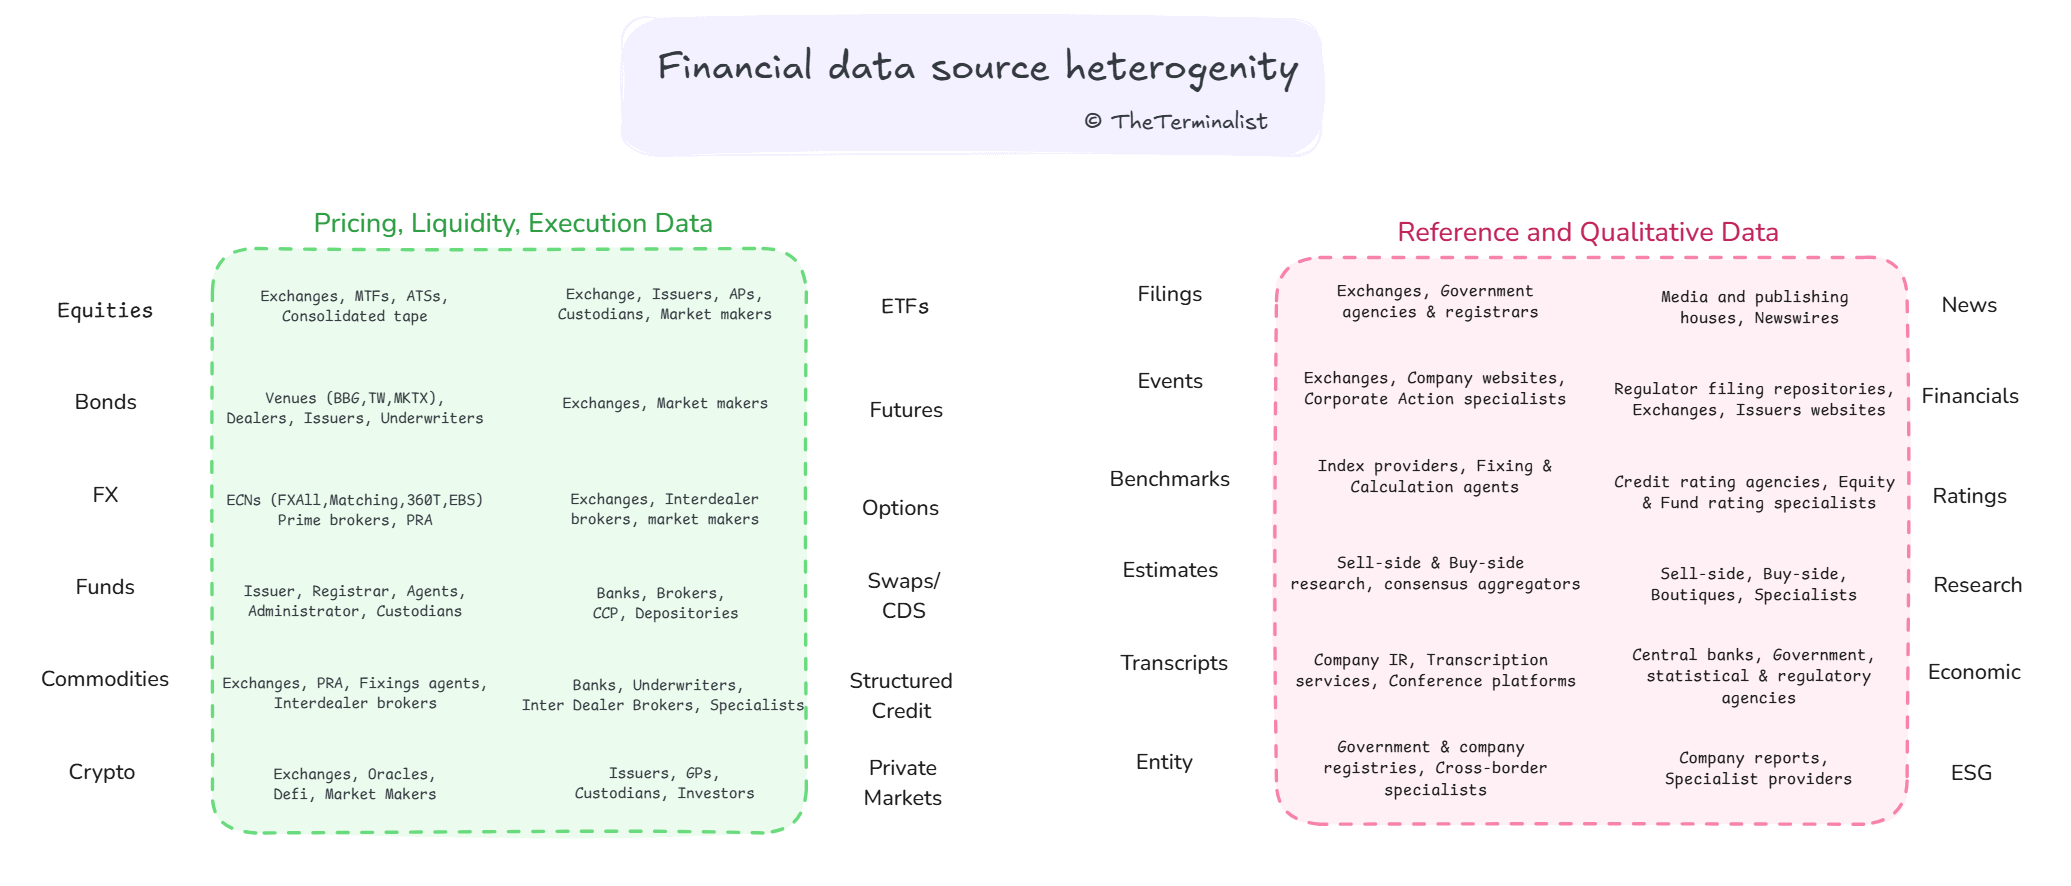
The examples above highlight a fraction of the data categories and types. Distribution incumbents hold a declining share of access to exclusive sources. The trajectory shows no sign of reversing.
The integration defence
The integration defence claims that meaningfully stitching together heterogeneous and homogeneous data is a problem that only Distribution has solved at institutional scale. The specialist vendors and commercial products that have decomposed the integration problem into modules offer an alternative explanation and a competing product parallel.
At the industry infrastructure level, DTCC operates a Security Master File Data Service as a de facto utility, commoditising a core integration component. Gresham Technologies’ Opus EDM platform — the former S&P Global enterprise data management business — supports 30 of the top 60 global asset managers across $12 trillion in AUM. Arcesium — carved out from D.E. Shaw’s in-house data infrastructure and commercialised as a product — provides connectivity to 50+ reference data, pricing, valuation, and corporate actions providers, and supports $6.4 trillion in assets. Indus Valley Partners serves 235+ fund managers across $6.5T+ in AUM. Managed ticker plant services (Exegy, Pico’s Redline, NovaSparks), integration experts (MarketsIO) and security mastering assets (Rimes and Golden Source) make post-ingestion processing contractable.
A perimeter that has generated multiple competing commercial products is less defensible than it once was. The last decade has seen participants’ understanding of the problem improve. Entity resolution is a hard but bounded disambiguation problem. Cross-source reconciliation operates on a limited set of defined methodologies. Time series continuity issues have known structures. Cross-vendor integration9 by definition is not for incumbent vendors to capture. What sustains integration friction today is no longer complexity. It is that many client-side assemblers have not yet mapped what the available modular ecosystem can do. Increased awareness of alternative offerings is slowly dissolving that barrier.
The sourcing position and the integration premium follow the same trajectory. Both are contracting on a shrinking perimeter. Neither offers a defensible moat. The proof is in the firms that have breached the perimeter across stages.
When moats are laddered
What Distribution built was expensive to replicate, not impossible to circumvent. The four firms below attacked the sourcing and integration position across orthogonal datasets and use cases. The moat was crossed in each.
Databento — ultra-low-latency real-time market data. Real-time market data, on Bloomberg’s and LSEG’s terms, meant dedicated proprietary infrastructure, bundled SLAs catering to the widest possible client segment, opaque per-seat pricing, and long sales-led contract cycles designed for lock-in. Databento inverted each element: cloud-native architecture, public standard APIs, usage-based pricing, and a self-serve platform accessible without a procurement cycle. It also surpasses industry standards, achieving nanosecond precision with dedicated protocols and bare-metal stacks. The purest form of a cracked engineering team using code end-to-end. B-PIPE and Elektron are being architecturally circumvented. Today, Databento is licensed across 60+ trading venues, counts every major quant logo as a customer, and is estimated to be growing revenue at 30% per month—well enroute to unicorn status.
Daloopa — KPI extraction and fundamental data curation. Daloopa was founded in 2019, pre-LLM, on a library of well-defined extraction scripts and ML models trained on structured financial filings, with human review of sampled outputs and edge cases. The rules that extract KPIs from earnings releases, reclassify non-recurring items, and standardise segment structures don’t require continuous expert knowledge once distilled. They can be reverse-engineered from sufficient sample data and iteratively refined on a much faster feedback loop using machine learning. The specialist model cannot compete with the speed, sampling, and scale that code can achieve. A codebase and downstream operations built on ML-first principles, without technical or process debt, are compounding assets estimated to generate north of $20m in ARR. Seven years in, Daloopa covers 5,500 public companies globally and has 4-10x as many data points per company as its peers, with a 14-year data history.
Visible Alpha — consensus estimate aggregation and synthesis. Visible Alpha aggregated granular sell-side model data at the line-item level — not just headline revenue and EPS, but the full underlying model structure, allowing buy-side analysts to compare how sell-side models were constructed, not simply what they forecast. Distribution could not replicate the product natively despite access to the same brokers; incumbent pipelines were not architected to aggregate at that granularity. A few founding brokers collaborated to build it themselves, gaining rapid institutional traction and eventually an acquisition by SPGI. Today, Visible Alpha covers 7,300+ companies across 250+ contributing sell-side firms, averaging 156 consensus line items per company — against the handful of headline items traditional consensus captures.
AlphaSense — AI-native document synthesis. AlphaSense was NLP-first from its founding in 2011, on the premise that institutional research workflows were a document-comprehension problem rather than a data-retrieval problem. That document-oriented architecture enabled it to build across unstructured source types at scale. Today, it aggregates data from more than 10,000 sources — licensed sell-side research, regulatory filings, earnings transcripts, news, and proprietary data pipelines — through a unified document synthesis interface. The same capability that reads an earnings transcript also reads broker notes and regulatory filings. Specialist-per-source and specialist-per-task collapse into one intelligent codebase. Penetration across 88% of the S&P 100 settles institutional-grade calibre. $500M+ in ARR and 6,500+ customers across 80% of top asset managers confirm the scale.
These four are illustrative. Across dozens of active challengers attacking every stage of the pipeline — from solo-founder data plays to well-capitalised platforms — the same architecture recurs: code-first, API-native, LLM-ready, built on public or licensed substrates, without the cost base required by the specialist model. Distribution’s pipeline defences are crossable, and, unlike cartography, are being laddered across stages simultaneously. With the right stack, the historical moat distinctions between Aggregation, Transformation, and Delivery are analytically moot.
Stack demotion
In the final sub-stage, the threat isn’t in parallel pipelines but in the delivery architecture that disintermediates the endpoint. The financial data stack is already reorganising around new consumption models that decompose incumbent platform economics.
A client that received its data from a single-vendor relationship a decade ago now routes that data through a cloud infrastructure provider, stores and transforms it in a warehouse or lakehouse environment, governs and traces it through observability tooling, normalises it across sources via an MDM/EDM provider, and reports against it through separate regulatory and compliance infrastructure. Distribution’s share of the total institutional data stack is declining, even though no contracts have been cancelled. The terminal and the aggregated feed handler are no longer the sole delivery architecture — they are just one vendor among many in a stack they no longer anchor.
Usage-based pricing is the other disintermediation vector. As components are individually priced, any margin claimed as part of a bundle must be justified on its own. Many components don’t clear that bar, and that failure has historically been the wedge for niche entrants. Pricing power deteriorates, attracting end-point competition when it’s least welcome.
Yet terminals are opened each morning across trading rooms around the world. Risk systems rely on data contracts signed years before any alternatives existed. The terminal and feed are deeply embedded in how institutions operate. That stickiness alludes to switching cost, which is a different kind of claim deserving of its own test.
Act 3 — The Workflow Defence
Loyalty or captivity
Switching costs as a moat are almost always assessed from the vendor’s perspective. The test that matters, though, runs from the buyer’s side. From a client’s vantage point, a relationship based on extractive pricing rents and high exit friction is captivity dressed as loyalty. Genuine loyalty and moat strength stem from creating new value over time: deepening dependencies the client actively wants, expanding what the vendor uniquely provides, making staying more valuable than it was the year before. A position built on exit friction alone produces a client who stays only until alternative value providers can offset that exit tax.
From the outside, the two positions appear indistinguishable. Both sustain revenue. Both renew contracts. An incumbency premium can boost revenues through periodic price increases long after the structural position has begun to erode. Revenue measures value captured as a lagging indicator — not whether the position is strengthening or hollowing.
The right test requires leading indicators — contra-evidence: specific functions departing, clients routing workflow elsewhere, or engineering teams building direct integrations rather than paying the terminal premium. These reveal preference rather than captivity. Its revenue impact won’t register until the parallel test is done, the migration is complete, and the contract renewal fails or price yield declines.
Four mechanisms carry the evidence.
APIs and modularity
A new entrant to financial data in the 2010s faced a problem: the terminal was the operating surface. Bloomberg and FactSet had spent decades weaving themselves into daily workflows — the keystrokes, the panel layouts, the shortcuts burned into the analyst’s muscle memory. Competing for that screen estate directly was not a viable entry strategy. So challengers did not try. They went around. A specialist data vendor was forced instead to make its data clean, well-documented, and connected. A RESTful endpoint, a well-defined schema, and standardised authentication. Back-end to back-end. A data connection, made at the point of least resistance. The challengers had no choice but to build with modularity in mind. And to the discerning eye, architectural modularity sufficiently scaled across the ecosystem reveals replaceability.
API-first infrastructure is rarely built around a single vendor. A buy-side data engineering team does not build towards a single point of failure. The API layer is multi-vendor-ready by design, even if only one vendor is connected at launch. The first integration pays the inertia tax. Every subsequent integration builds on the existing architecture and incrementally expands the client’s capacity to route future workflows to lower-cost alternatives. In practice, this means switching ability is diffusing slowly across a surface that is too wide for incumbents to identify where to defend.
The buy-side’s adoption of alternative data was the first proof of it at scale: firms that paid for alt data on top of terminal subscriptions demonstrated an appetite for multi-vendor complexity, and the data engineering infrastructure built for that purpose became the substrate on which every subsequent integration runs. Wellington Management operates across more than 100 market data providers. Every top-20 market participant in any client segment operates a mature, multi-vendor data environment. A modular, API-ready architecture is necessary at this scale, seeding the environment for the lowest-cost alternatives to meet the workflow specification.
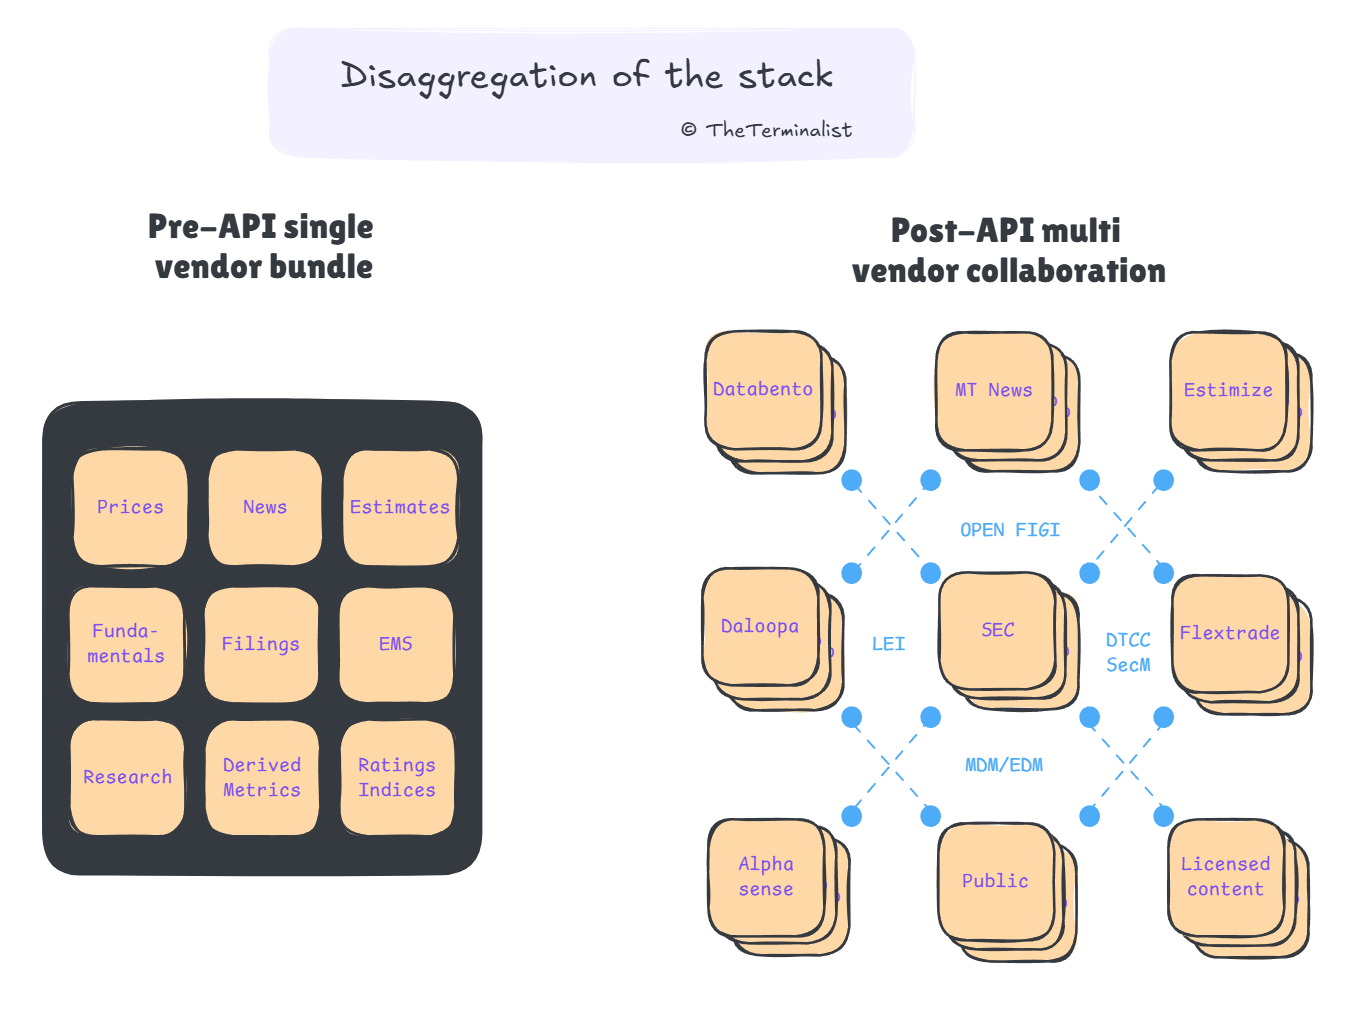
The CapIQ displacement of Bloomberg and Eikon in investment banking is the evidence at the UI surface, where the switching cost was, if anything, higher. CapIQ captured the IB workflow not by matching the terminal’s depth but by meeting the IB specification at a substantially lower cost. Investment banking workflows do not require real-time data across all global exchanges, OTC derivatives engines, and fixed income RFQ infrastructure. CapIQ recognised that incumbent terminals were pricing the investment banking segment the same way they priced their trading counterparts. The specification routes to the lower-cost provider when the workflow doesn’t require the full package. This happened at the UI surface, against the full weight of generational muscle memory. API-native providers don’t face that barrier.
Below the terminal surface, the specialist vendor ecosystem has expanded across every workflow category, as most financial workflows are highly specified. Order management. Execution. FX and Options analytics. Risk engines. Portfolio analytics. Each is highly deterministic in both process and outcome, making it fully specifiable and highly contested by specialist providers.
But if every workflow outcome can be an API call, where does the locus of control sit?
Data and decision gravity
The system-of-record platforms10 — Aladdin (BlackRock), SimCorp, Charles River, StateStreet Alpha —are where portfolio management, risk calculation, and instrument lifecycle event management actually take place. They are also the platforms to which downstream processes write: cash flow reconciliation, trade settlement, redemption processing. These platforms differ from Distribution not in scale but in what they hold. At the centre of each is the Investment Book of Record — the IBOR: the authoritative, real-time ledger of a fund manager’s positions, exposures, and cash. The IBOR is the organisational centre of gravity around which everything orbits and to which everyone else defers.
The tell is in the direction of data flow. While the terminal is where some analysts work, it is an input dependency. The system of record is where the work outcome lives. Data flows to Aladdin. Investment decisions are made in Aladdin. Portfolio positions are maintained in Aladdin. Compliance is monitored through Aladdin. The system of record is the buyside’s operating system. The dependency runs one way.
The IBOR operators have shown a clear direction. Aladdin has systematically expanded into territory previously served by Distribution. The Aladdin Data Cloud — a managed data-as-a-service platform built on Snowflake — delivers pre-loaded Aladdin datasets and enables clients to integrate third-party and proprietary data in a standalone, Aladdin-hosted environment. The eFront and Preqin acquisitions brought Aladdin a unified pre- and post-investment platform for private markets. FlexTrade’s multi-asset EMS integration provides Aladdin clients with execution management capabilities outside a terminal.
SimCorp’s trajectory mirrors the same expansive ambition. Deutsche Boerse’s €3.9 billion acquisition in September 2023 combined SimCorp’s multi-workflow front-end with Qontigo’s risk capabilities (Axioma and STOXX indices), and ISS managed operations within a self-contained Investment Management Solutions segment — explicitly positioned as a front-to-back operating platform competing for the same decision-control territory as Aladdin.
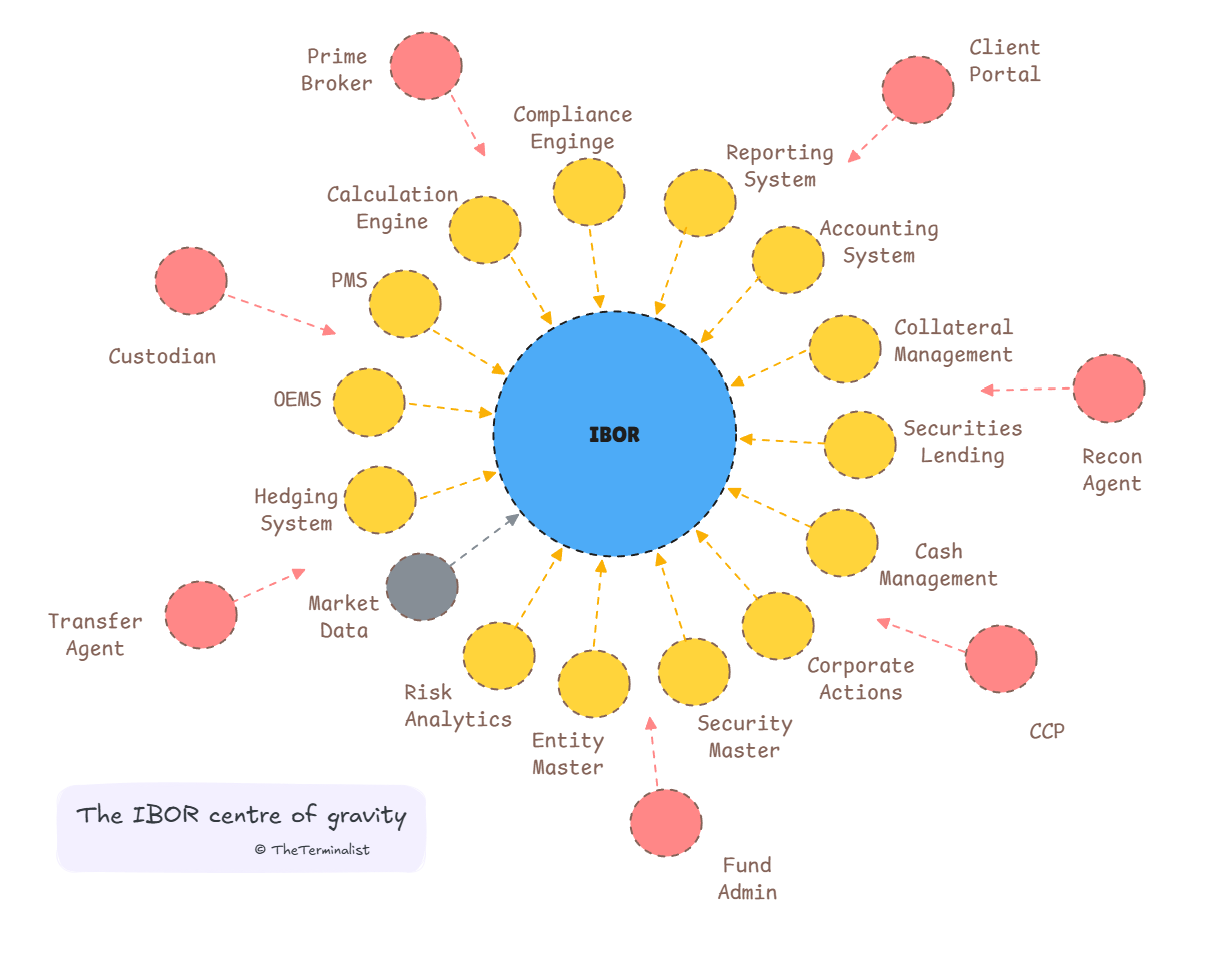
IBORs do very distinct work to market data terminals. But the control plane matters. IBORs have the structural option to switch data delivery partners or internalise capability — because client dependency runs towards their environment rather than towards the data intermediary. The simple test is that the inverse is not true.
The threshold is crossed when a client running their investment process in Aladdin begins to question why they are paying a Distribution premium for a workflow wrapper on a market data feed. The client does not ask: “Is Aladdin’s data better than FactSet’s?” They ask: “Is Aladdin’s data and workflow combined good enough to make FactSet’s workflow wrapper optional for a meaningful subset of users?” These are independent questions with different thresholds. The second is far easier to clear.
UI-less and seat-less consumption
Algorithmic trading systematised financial data consumption more than two decades ago. Strategies that began on terminal screens progressively migrated to direct market data feeds, black boxes, and protocol-level connectivity as they became fully programmatic. The bleeding-edge use case for algorithmic access, HFT firms, routed right past Distribution and went straight to the source, co-locating at the exchange while extracting every ounce of efficiency and latency possible. Connecting across 10,000 sources and processing 40TB a day cannot be outsourced at these stakes.
The sell-side was forced to mirror algorithmic capabilities, or risk being picked apart. Headcount reductions at trading desks across banks are well documented. So was the flatlining of terminal growth that followed. Distribution fell prey to its own commercial trap. Its pricing premium was built around the terminal interface—a consumption model with no interface and no workflow integration, routed around that pricing structure entirely.
The agentic wave extends the logic to a far broader population by reducing the engineering overhead required to operate it. What changes is that the human workflow is no longer the reference point. Agents carry no UI preference. No workflow inertia. No muscle memory for a keystroke sequence. Their success depends on routing to the lowest cost provider that meets the minimum usecase specification. Distribution’s pricing premium for human navigation declines further. As agents become more capable, connected, and cost-efficient, the barrier to bypassing the incumbent consumption model is lowering, and their topline is where you’ll see it last.
Screen and work surface loss
Agentic consumption bypasses Distribution programmatically. AI-native workflow replacement bypasses it functionally — performing the work outside the terminal environment altogether. While the mechanism is different, the implication is more direct. Not that data can be sourced elsewhere, but that the daily workflow functions the terminal houses can be replaced, part by part, then entirely.
The structural seam lies in analytical workflows. Those that consume content for the insight it carries, not the information it records. The terminal was engineered for data retrieval, not synthesis. AlphaSense was the first-generation proof. An analytical workflow delivered through a web platform won screen estate because it was not competing for the same function.
The emerging workflow challengers operate on the same seam across a far broader surface, with far greater capability — extending simultaneously to document synthesis, document generation, and research automation. Capabilities outside the reach of any native terminal architecture. They materialise a new and expanding addressable market, right when the cost of building each incremental capability and supporting each incremental client falls. The following examples illustrate a pattern of acceleration.
Hebbia extends the document synthesis model to a broader tier. The client’s internal knowledge is tied together - historical models, prior deal analyses, discussion memos, portfolio history – along with external data. The result is investment process compression: multiple teams across the same firm, including investment, risk, legal, and compliance, all working from a unified operating environment with full context across internal and external knowledge simultaneously. Hebbia processed 1 billion pages in September 2025, up from 47 million a year earlier and counts BlackRock, KKR, Carlyle, and Centerview Partners as institutional clients.
Rogo targets document generation: pitch deck production, strip profiles, investment memos — the routine output that takes up a significant share of junior bankers’ time. Rogo calls market data from whichever vendor the client is already tied to. It does not replace the data source. What it displaces is the terminal as the primary work surface — and the commercial premium that surface commands. Revenues have been known to grow 5x over the past 6 months and are accelerating from the eight to nine-digit mark. Rothschild, Jefferies, Lazard, Moelis, Nomura, and Raymond James are among confirmed institutional clients as of early 2026. Unsurprisingly, a capability that automates routine document generation on the sell side necessitates adaptation to the buy side. Rogo’s acquisition of Plux was the formal statement of intent that slipped under the industry radar. As has it’s launch of Felix, an enhancement to long-context windows paired with agentic execution, hinting at the ambition taking shape.
Fintool (now acquired by MSFT) automates equity research workflows, processing 1.5 billion tokens daily across 70 million document chunks. Metal aggregates deal data, expert transcripts, and firm history for private markets intelligence. Blueflame unified internal and external knowledge for alternative investment managers and was acquired by Datasite. Across equity research, private markets, and in-house knowledge management, the same workflow capture pattern by new entrants repeats. Each migrating function narrows the scope of what the terminal exclusively provides.
The shrinking perimeter - II
The four mechanisms above attack Distribution’s workflow position at the visible surface. Two counterarguments claim the visible surface is not where the value lies. The first: even if workflow wrappers can be copied, the underlying computational guarantee cannot be replicated. The second: even if individual workflow components can be sourced elsewhere, the integrated bundle retains value that the sum of its parts does not.
The computation defence
Much of Distribution’s computational infrastructure - standard analytics and risk frameworks - is mostly public domain, and where proprietary is rarely unique. Markowitz mean-variance optimisation (1952). Sharpe (1966). Fama-French three-factor analysis (1992). Not one of these belongs to the vendor running them. Value at Risk, concentration ratio, and tracking error are highly standardised. Bayesian modelling and Monte Carlo simulation run on well-known mathematical principles. Performance attribution, risk analytics, portfolio construction and stress-testing - none are unique. The vendor’s contribution in most proprietary claims is fine-tuning at the fringes: parameter choices, data inputs, edge-case handling. That is a subjective position that can be matched. The list of vendors offering these frameworks is now so broad that it no longer serves as a differentiator. What Distribution holds as proprietary computational assets will only narrow by design. Comparative measures only work when there is consensus. Client-developed analytics that drive firm IP and alpha were never Distribution’s to begin with. The unprotected perimeter of computational capability is large.
The bundling defence
Distribution’s product architecture rests on the bundle — pricing, news, analytics, messaging, and execution, all in one surface, subscription and price. While it adds convenience and reduces sourcing and aggregation overhead, bundling does not make any of those components more accurate, more reliable, or structurally harder to source independently. That is the string a challenger can pull on.
The bundling defence rests on four conditions holding simultaneously: that components remain irreplaceable, that the terminal is the firm’s operating environment, that all buyers value the whole bundle equally, and that functions are better served when bundled than when purpose-built. The four contra-evidence mechanisms address each in turn. API-native delivery makes components substitutable by lower-cost alternatives that meet the specification. System-of-record platforms relocate the operating environment to where investment decisions are identified, executed, and monitored. Algorithms and agents route each task to the best-in-class, thereby decomposing the value-capture mechanism. New workflow tools demonstrate that purpose-built solutions exceed incumbents in capability, meeting new needs incumbents simply cannot. None of the four conditions hold.
Distribution’s answer to sustained buyer pressure has been to break the bundle with modular licensing: individual datasets and analytical modules now offered à la carte. Vendors are selling components through multiple delivery and partner channels, at discrete and opaque price points, in search of revenue at ever-decreasing margins. We’ve crossed the point of no return. Vendors don’t un-modularise.
Inertia as a moat
The mechanisms, read as leading indicators, show loyalty fraying under pressure on every axis. The compounding test asks if Distribution is capturing new value by creating fresh dependencies. The terminal has been improved, and the product is better than it was five years ago. But the improvements are of degree, not of kind: more data coverage, more workflow modules, a better interface. Document synthesis, harnessing captive proprietary data, native foundational model integration — the new use cases the industry demands — are all being built outside the terminal. The compounding dependency is missing.
Stickiness that cannot be distinguished from a painful-to-leave product hides a peculiar risk. Not that clients leave en masse, wholesale vendor replacement in one move is not how this unfolds. The risk is that switching decomposes into discrete, workflow-specific packets, each small, manageable and paid for separately. A buy-side data engineering team that builds a direct exchange feed integration has paid a small switching cost that compounds. The next integration is cheaper because the home-grown infrastructure now exists. The learning curve has been climbed. Each migration builds institutional capability, comfort with vendor diversification, and multi-system operational and technical fluency. Switching costs are not fixed — they are recalibrated downward at every renewal cycle when price increases aren’t accompanied by offsetting value.
The distribution fallacy arises when switching cost is treated as inertia, when process complexity is treated as legible and bounded, and when contextual payloads are treated as functionally unprotected. Distribution is being squeezed at the data, process, and workflow layers. The market provides the necessary proof.
Act 4 — The Fallacy Priced
Encircling competition
The corporate record is unambiguous. Over the past decade, Production and Activation players have systematically directed capital towards Distribution. Each transaction a revealed preference: the acquirer believed Distribution’s function was either replicable, capturable, or better served by another stage. Taken together, what appears to be incremental competition over an extended period reveals encirclement by sizable challengers from all directions.
Production — exchanges pressing downstream. ICE’s acquisition of Interactive Data Corporation and BondPoint extended the exchange’s reach from its core equities provenance function deep into fixed-income data and workflows, bolting on an execution front end to feed the data pipeline into ICE Bonds. CME’s acquisition of BrokerTec and EBS via NEX extended capabilities from matching engines and commodity order books to the upstream workflow endpoints, where FX orders are placed and liquidity is sourced. Deutsche Börse assembled Axioma, Qontigo, and SimCorp into a purpose-built analytics and operations stack. Nasdaq acquired Quandl and eVestment — moving into alternative data, investment analytics, and buy-side workflow; its acquisitions of Verafin and Adenza extended the reach further into risk and compliance. In each case, an exchange enters the analytical and service layers that Distribution has historically occupied, with the data advantage of a source owner and the ambition to increase margins by reducing the intermediary’s cut. The land grab in private markets is the latest iteration of this attack.
Activation — acquiring workflow assets. MSCI’s acquisitions of Real Capital Analytics and Burgiss brought commercial real estate and private capital transaction data into direct distribution alongside its index products — routing captive data through its own channel. Its decades-old acquisition of Barra gave it permanent ownership of portfolio risk analytics workflows. S&P Global’s acquisition of IHS Markit absorbed the largest independent OTC data vendor, adding pricing services, feeds, and workflow tools. SNL Financial added historical datasets. Visible Alpha and ChartIQ added workflow tooling. With Intelligence added private market data pipes. The combined entity is as much a Distribution player as a ratings and index business — except that it owns the underlying data and the two Activation functions that Distribution cannot replicate.
The client tier. Goldman Sachs Marquee, J.P. Morgan Markets, Citi Velocity. Anchor Tier 1 institutional clients are commercialising proprietary data directly to buy-side clients. Goldman offers external clients direct access to proprietary derivatives pricing, analytics, and risk data. J.P. Morgan and Citi give institutional clients direct access to internal flow, cross-asset portfolio analytics, FX positioning data and systematic signals. Many of these datasets have no comparable that Distribution can offer or replicate. Nor does Distribution offer the right vehicle for banks or interdealer brokers to extract commercial value from their data.
Production. Activation. The largest clients. All are distributing directly. The intermediary’s territory is being entered from every direction simultaneously. There is a simple reason.
Distribution cannot retaliate.
You cannot build a coordination function by being more informationally precise.
You cannot build a certification function by being more analytically rigorous.
You cannot build transactional provenance by being more observationally accurate.
Distribution’s fallacy is mistaking position for protection, and it yields two financial signatures.
Pricing unpowered
Distribution’s bundled pricing works as a cross-subsidy. High-value components like unique data, analytics, messaging, and execution access funded lower-value parts within an all-or-nothing subscription, thereby commanding a premium that no single component could sustain on its own. Allowing component purchases separately removes that lock, forcing each to justify its price independently. Specialist providers first extract high-value components below the bundle’s implicit value, while low-value parts lose their subsidy. As workflows are cut, remaining functions must justify full prices, leaving a smaller, more expensive bundle for clients where disaggregation is operationally expensive. Incumbents further stall growth by hiking prices, unable to quantify the commensurate functional or feature improvements necessary to justify them.
LSEG’s terminal stagnation stretches back 18 years. Its combined estate currently sits at approximately 350k users, effectively unchanged from where the contributing assets, Thomson One and Reuters 3000 Xtra, collectively sat in 200711. Bloomberg has not meaningfully grown its terminal business since crossing 300k users in 2009, adding only 25k users over the 15 years that followed. FactSet, unable to compete in a mature premium market, went the other way. Revenue per user declined from $17k in 2016 to under $10k in 2025, despite overall revenue growth. FactSet grew by going lower, trading unit economics for volume, and moving from active buy-side into wealth management, where competition from digital-native alternatives is intensifying. The ARPU trajectory cannot reverse from here.
The cross-subsidy collapse is nearly complete. A decade and a half of price increases across the incumbents has yielded insignificant user growth, and the only volume growth has come from going lower. Aggregate revenue will still grow, but it should not be mistaken for Distribution’s pricing power.
Relatively losing
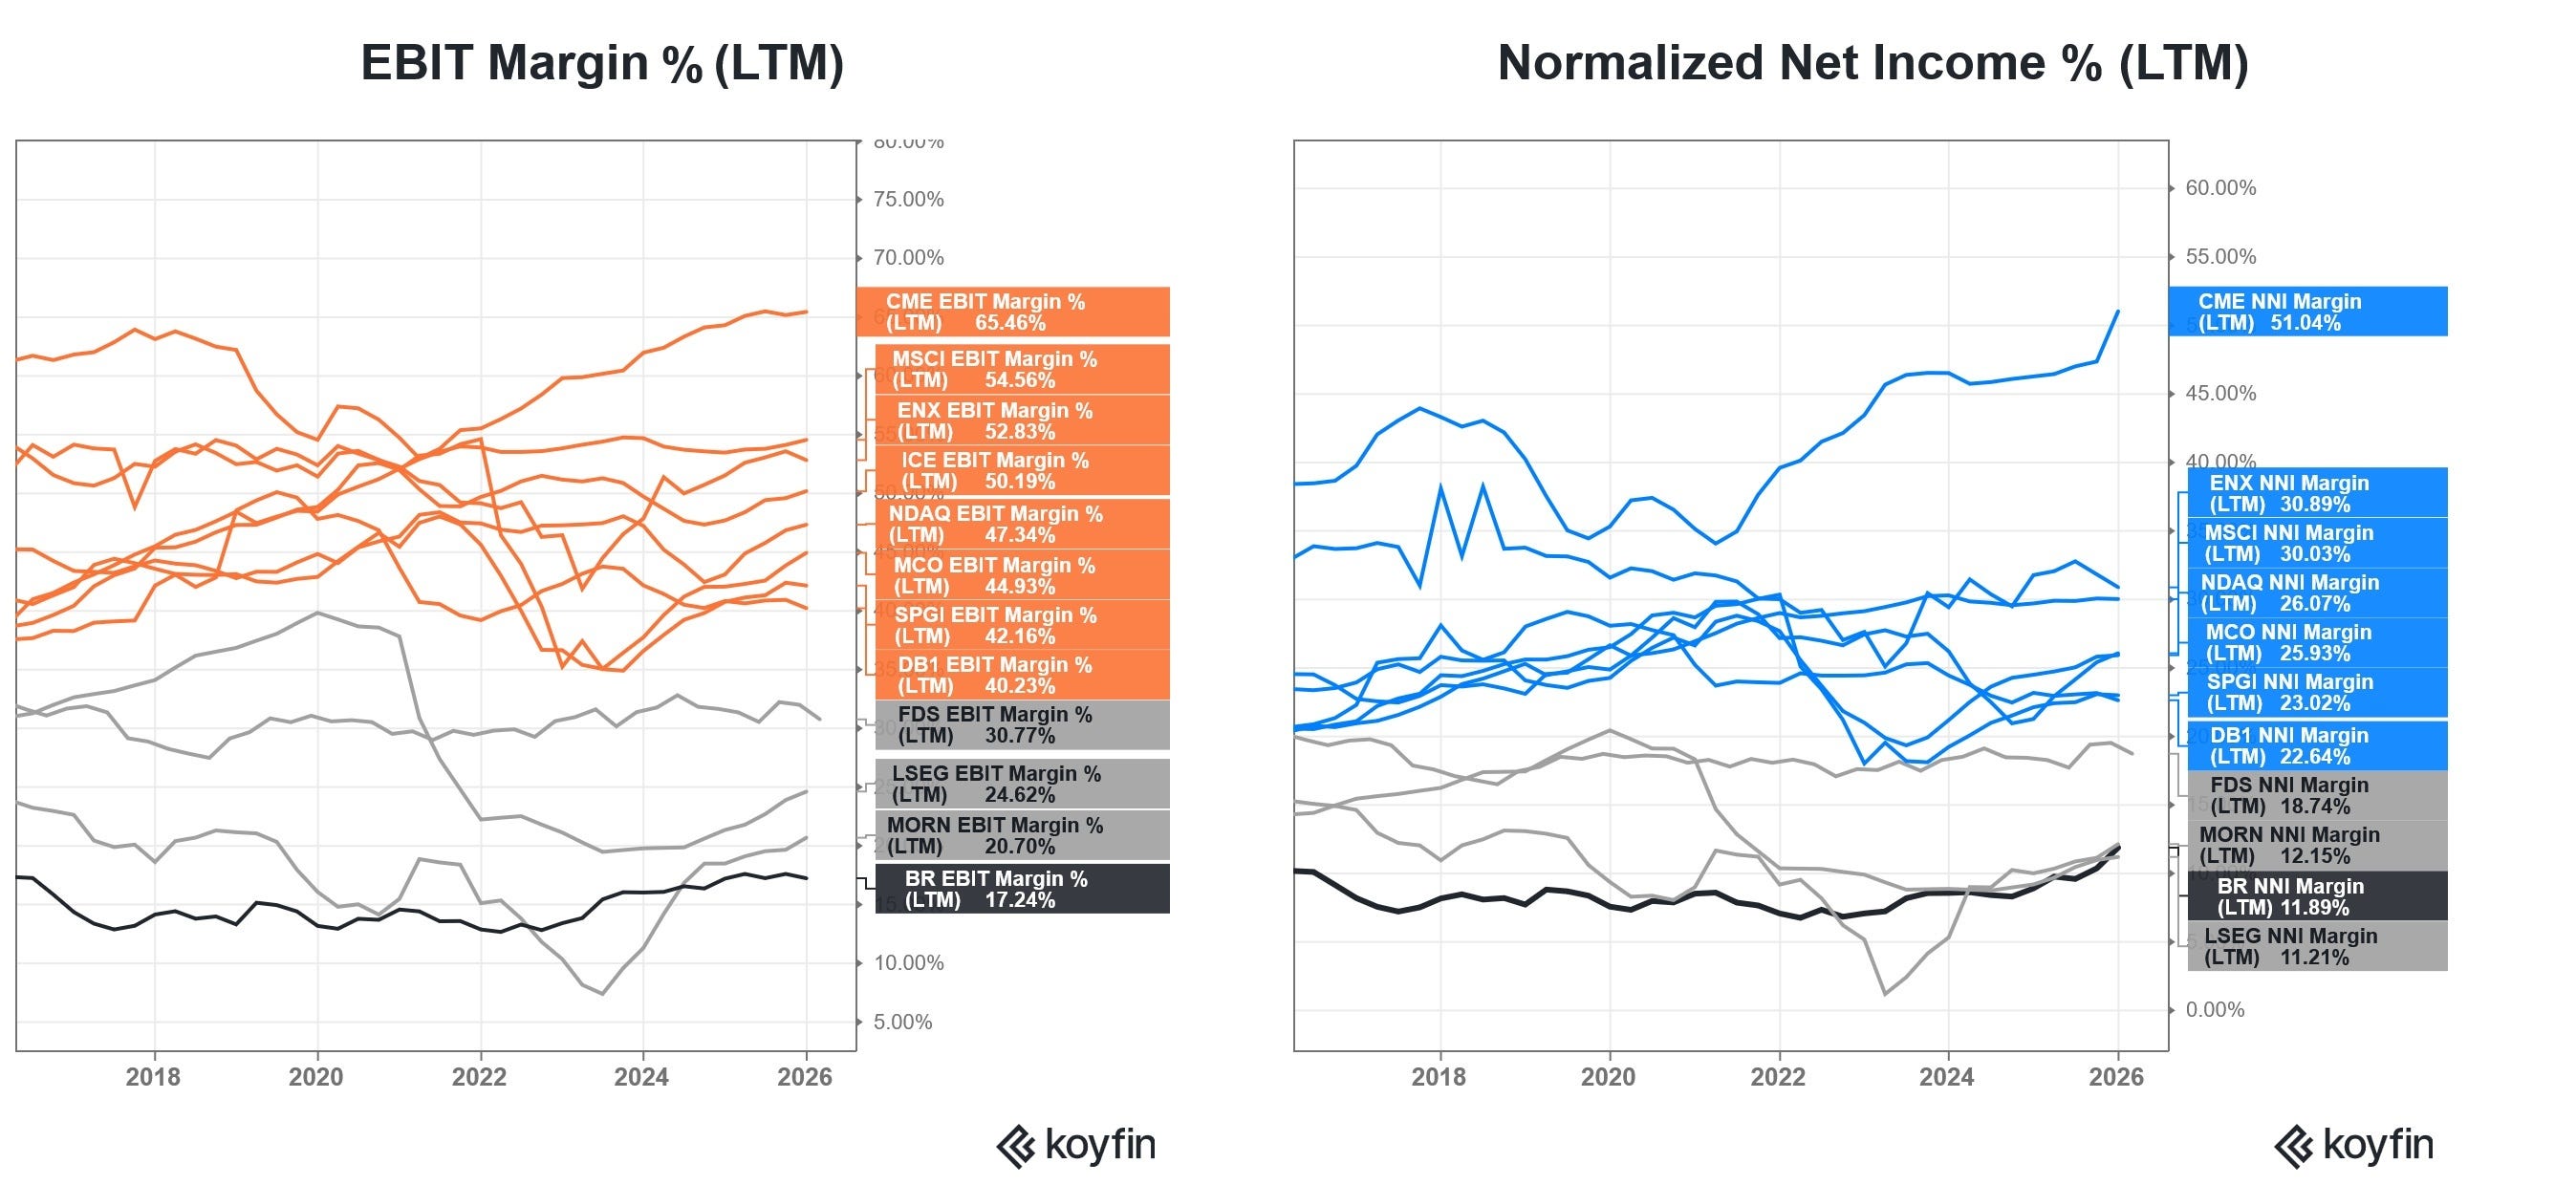
Margin compression provides the next hint. Distribution players collectively sit at the lower end of the industry range. No listed Distribution player (in grey) can surpass the least of the competition from Activation and Production12.
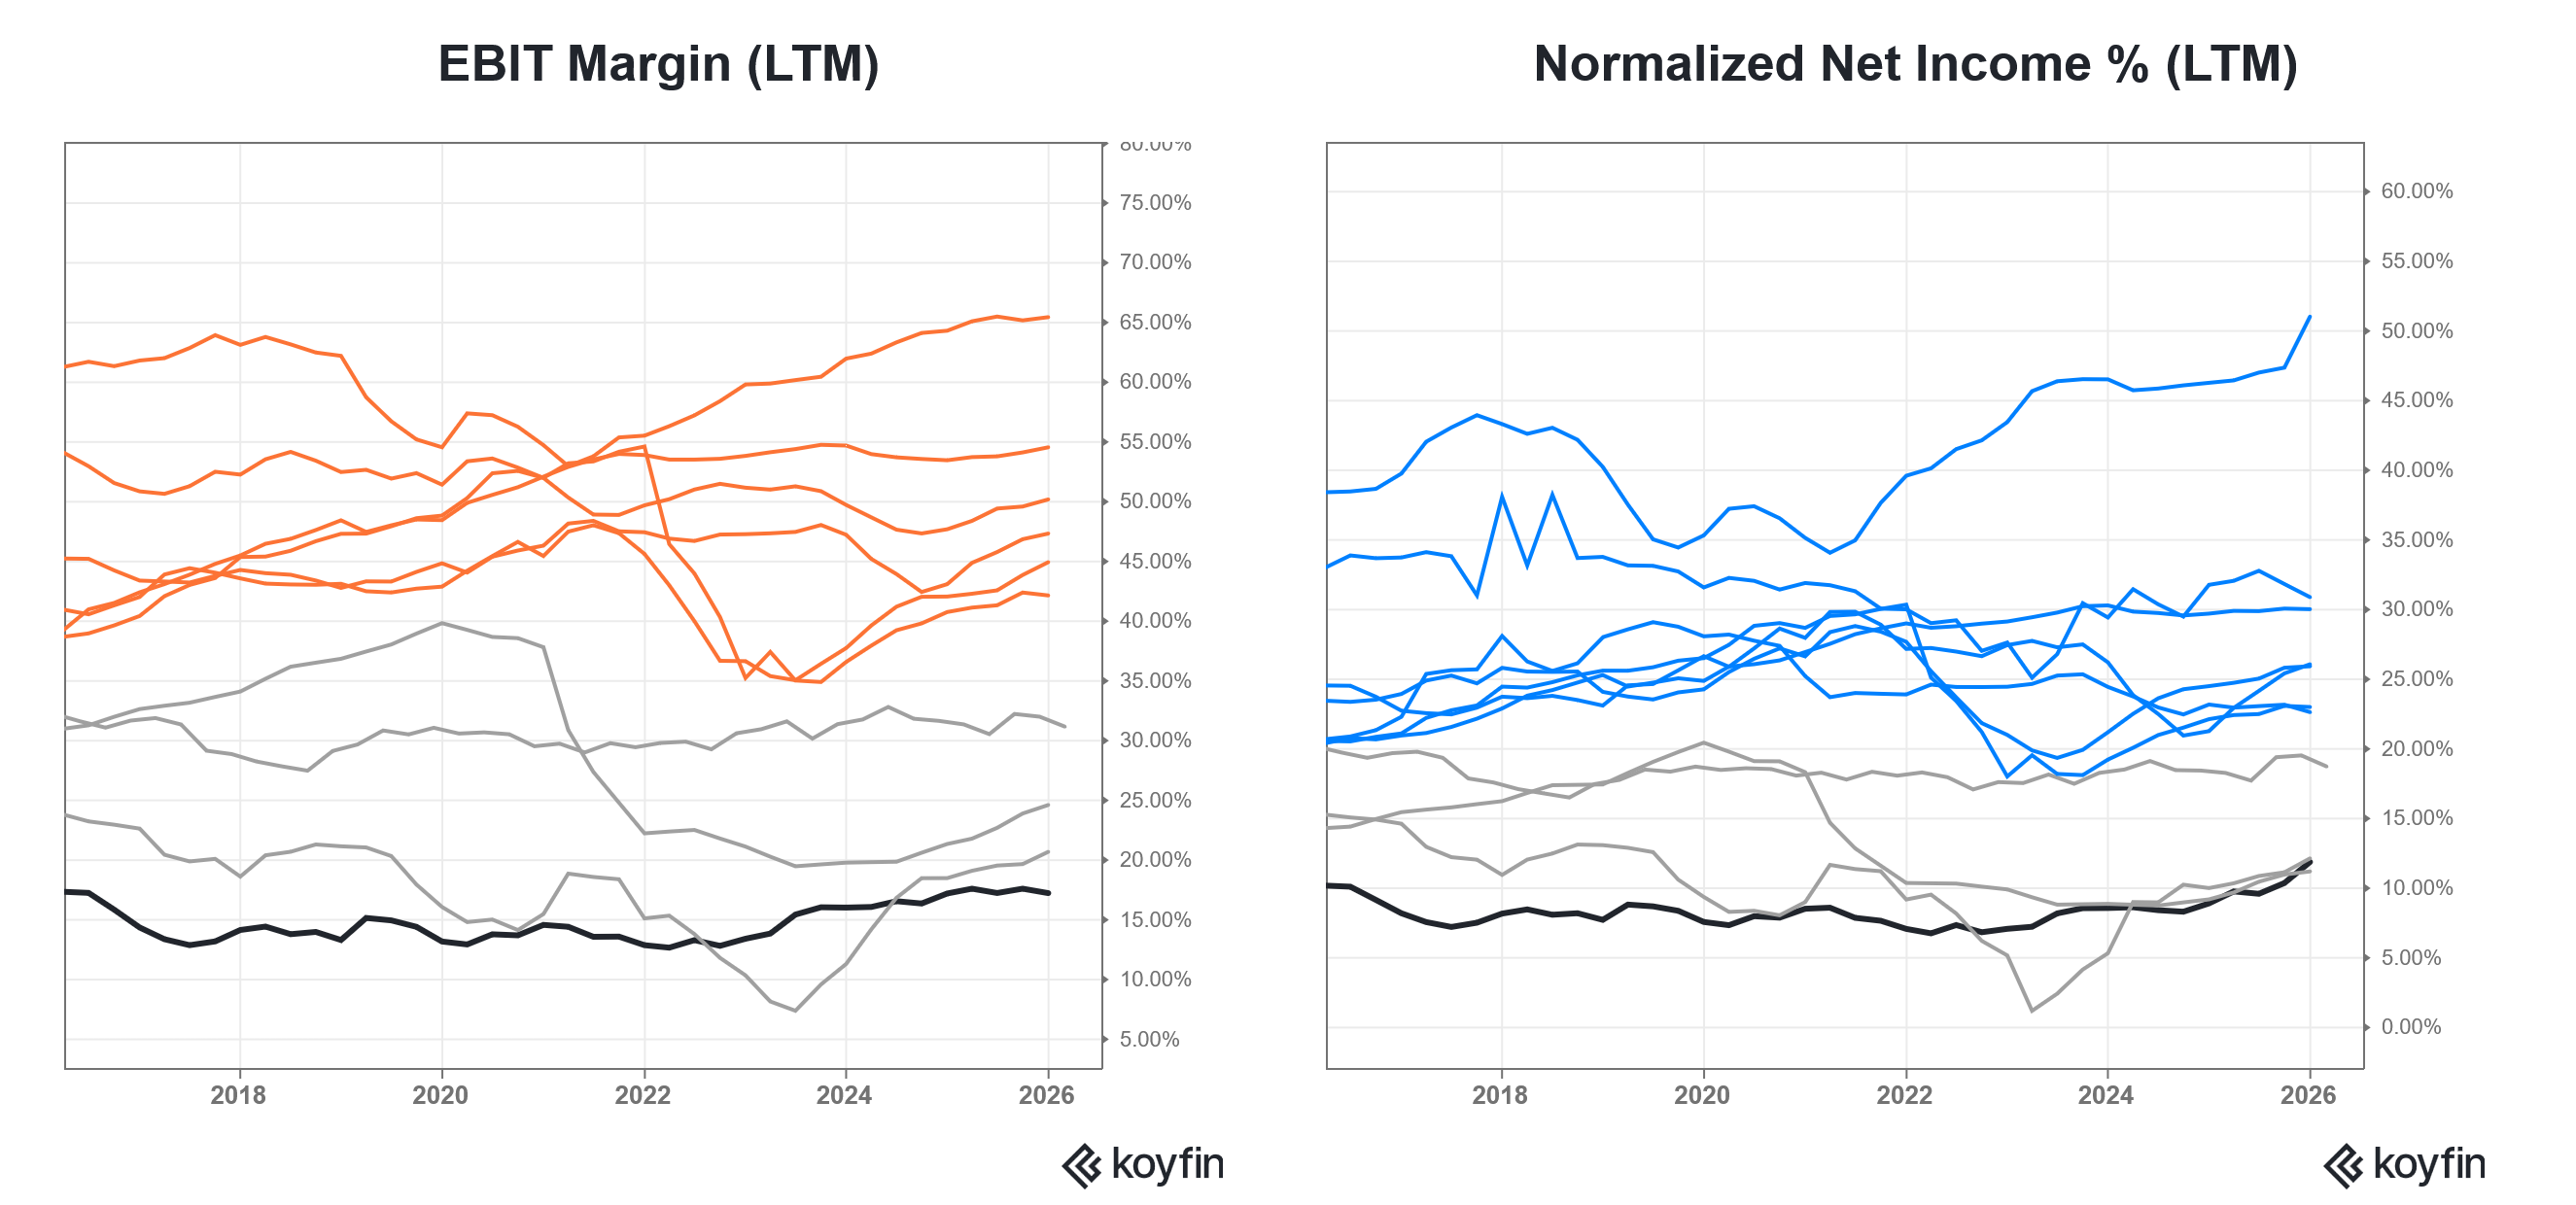
Revenue growth offers no reprieve compared with other Smiling Curve players.
Production and Activation. CME’s market data revenues, at an 8% CAGR (2020-2025), are growing roughly twice Distribution’s run rate — without analytical overhead or workflow embedding. At an 11.8% CAGR, Tradeweb’s market data is an execution exhaust growing nearly three times faster than the intermediary offering it. MSCI’s recurring subscriptions at a 12.8% CAGR compound nearly as fast as S&P Global’s index business at a 13.3% CAGR. Even BlackRock’s Aladdin technology services grew at a 10.5% CAGR.13
Meanwhile, FactSet’s ASV growth guidance has been 4–6% for three consecutive years (recently revised to 5–7% for FY2026, two quarters through). LSEG’s D&A business — the core of its Distribution assets, stripped of index and risk — reported 2–3% revenue growth over the two years since the structure was put in place. ASV growth has declined to under 6% over the last four quarters, while headline FY2026 guidance maxes out at 7.5% — but that figure carries 51% ownership of Tradeweb, whose revenues and growth consolidate fully onto LSEG’s balance sheet.
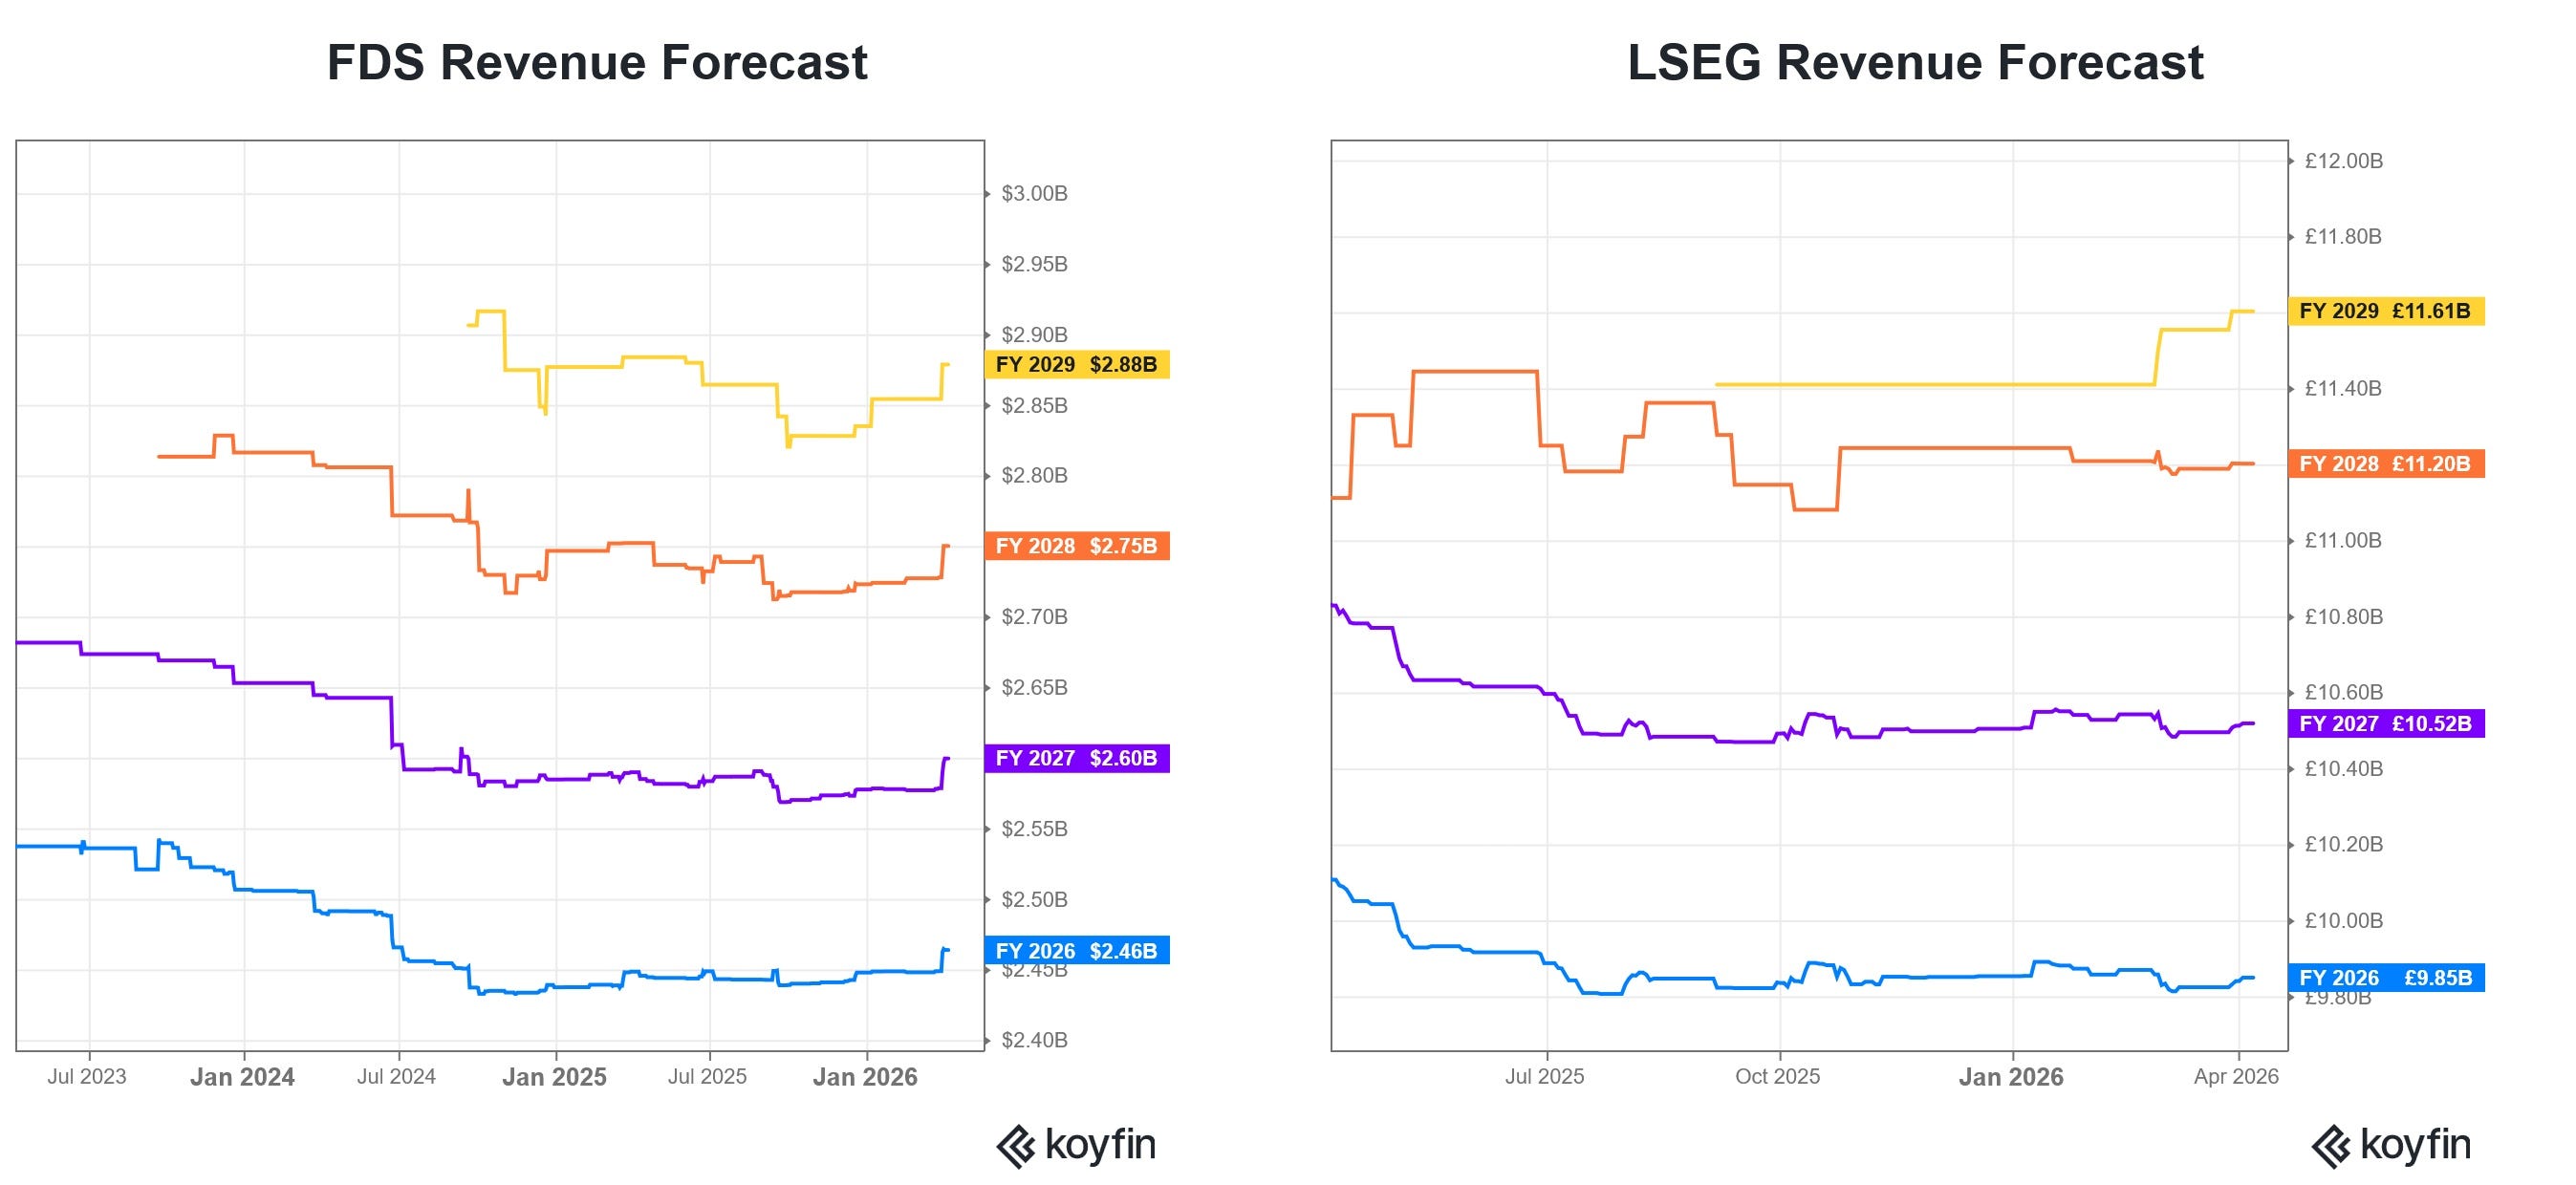
The contrast comes as a surprise to those who’ve been using the wrong yardstick. The industry’s dominant market share and sizing benchmarks measure this differently. It tracks competition within the Distribution layer — which terminal or feed gains share at the expense of which other. That frame produces a picture that incumbents find reassuring. Defining a layer’s endogenous competition as the market sticks when the market is opaque enough that the premise goes unquestioned.
Only in comparison is the summary stark. Production and Activation players show no signs of slowing down from their 8–13% growth rates. Distribution guides 2–6% growth. Distribution is not losing an absolute revenue race. It is losing a relative one. The question that remains is whether markets have reached the same conclusion.
Two de-ratings
They have not. Not fully.
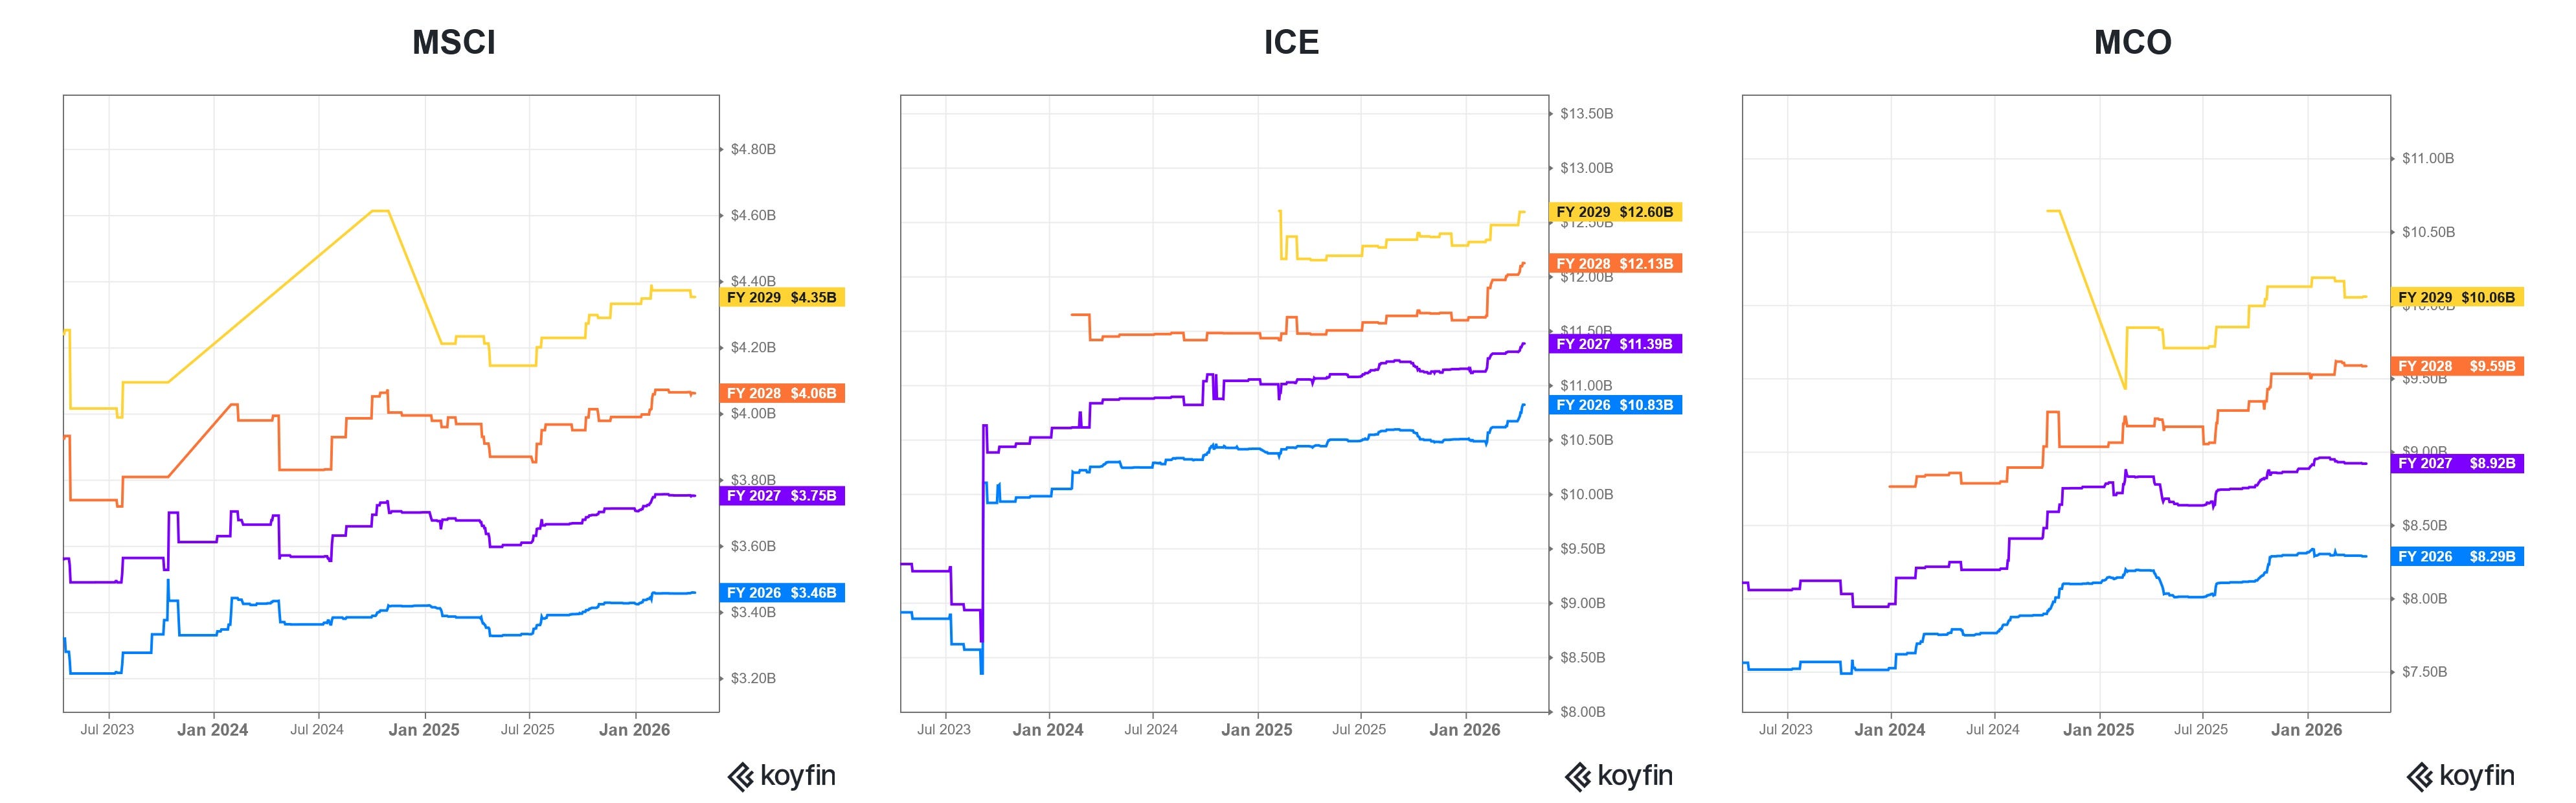
The first de-rating of growth rate deceleration has occurred. Revenue forecasts have been revised downwards. Markets have repriced Distribution players at lower growth multiples, reflecting the first-order effects of the structural argument that are now increasingly visible. This first de-rating has been wrongly misattributed to an emerging threat and is not the analytical opportunity.
Sell-side analysts are not incentivised to identify second-order decay. Their coverage mandate is the stock; their output is the near-term estimate. Challenging terminal-value assumptions that sit outside management guidance ends up putting analysts outside the client relationship. This post lays out what the market has yet to price fully.
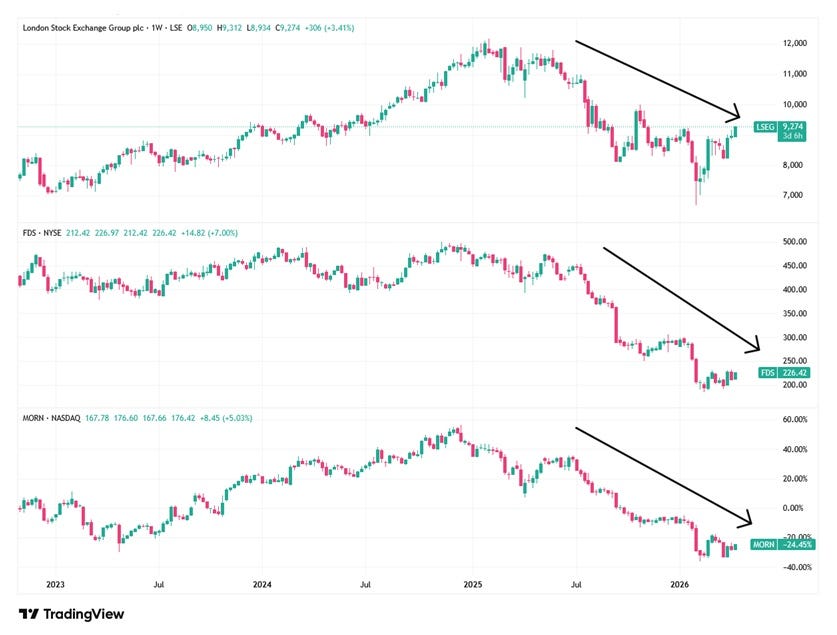
The second de-rating of terminal value assumptions is yet to happen. For subscription-revenue businesses, valuation is dominated not by near-term forecasts but by long-term steady-state growth rates. The current sell-side consensus embedded in Distribution equities reflects a specific set of beliefs: that the terminal bundle holds, that the existing workflow layer remains the only coupling between data source and client consumption, that margins stabilise because structural switching costs remain in place indefinitely. They assume pricing power is retained, that most workflows won’t route to lower-cost options, and that incumbents have material product upgrades in the pipeline that will bring them into the new age. The non-consensus opportunity lies in challenging those long-term beliefs which reside in the Distribution Fallacy. One that rests on appreciating the nature and scale of the satellite moment the industry is yet to absorb.
The satellite moment
What makes the fallacy more striking is that it did not require AI to be true. Instead, we’ve seen that the moats were already eroding before any large language model was commercially deployed. What AI provides is acceleration into a position that was already weakening, at a pace no incumbent can match, requiring new disciplines no incumbent is equipped to explore.
The threat now arriving has a precedent. The foundational labs are in a whatever-the-costs arms race. No one building foundational models is thinking about a terminal vendor’s economics. The capabilities they produce travel downstream across industries, much like the original space race that disrupted cartography. The missions that put satellites into orbit weren’t designed to put atlas publishers out of business. The disruption of map-making was a second-order consequence of a competition they had no part in, funded by national security and state actors they couldn’t influence, and driven by strategic needs that had nothing to do with them.
An era of atlas publishers became peripheral. Present, but nominally operating. No longer the architecture through which geographic knowledge moved. There was no Kodak moment. No headline collapse. Just slow, quiet, and permanent peripheralization.
The displacement came from challengers who built everything differently — and the distance between old and new was not a gap to close but a wholly diverging discipline to enter. The raw input was no longer a surveyor’s measurement or a hand-rendered illustration but binary imaging streams from orbital hardware, in formats the old workflow had no category for. Processing them required novel mathematics: converting spherical orbital capture onto a planar surface, accounting for satellite trajectory and path overlap, stitching thousands of images taken at myriad angles and altitudes into coherent terrain. Interpreting what that terrain contained required algorithms that could distinguish sand from streams, classify land cover from spectral signatures, and resolve features across resolutions. The talent behind all of it — trained in orbital mechanics, imaging hardware, advanced mathematics, and signal processing — shared nothing in common with the expertise that had made an atlas publisher excellent. Writing code required none of the old craft of sailing, navigating or sketching. There was no inherent development path, no hiring programme, no R&D budget that moved an incumbent from hand-drawn cartography to satellite image processing. The chasm was not a matter of investment or degree. It was a matter of category and kind, too advanced for incumbents to grapple with. The same properties that made it uncrossable for incumbents made it wide open for challengers stuck with none of the old stack, and every incentive to build a modern one.
Distribution is heading down the same path. The terminal will still open, and contracts will still renew. What the revenue line won’t carry is the pricing power, the growth rate, or the terminal value still embedded in today’s consensus. The incumbents who built them have the installed base and the inertia. They do not have the existential urgency, the incentivised talent, or the freedom to cannibalise what they built. What AI provides is the capability to move at speed against moats built in an earlier era, under different competitive conditions, with tooling that has since been superseded. AI-native challengers attacking Distribution’s pipeline inherit every model advancement without funding the research. Distribution risks damage from a capex race it cannot enter, cannot slow down, and will not be consulted about. The end-state risk isn’t obsolescence — it’s becoming peripheral.
The industry’s satellite moment has arrived, and the fallacy provides the perfect cover for challengers to make inroads. If you are building, operating or looking to fund opportunities in this space, get in touch and let me know how I can help.
The Terminalist
Follow me on X or connect on LinkedIn to chat. And do complete the poll that follows for more content.
h/t to Evan, Jason, JT, & Tim for their valuable feedback on this post.
Further Notes
The fallacy gives rise to two posts that are in the works.
The first makes the fallacy specific. We’ll take a single Distribution player and trace how the defences described here were constructed, where they are already showing strain, and why the visible strategic response - AI repositioning, product layering, adjacency expansion - is a symptom of the squeeze rather than an answer to it. If you’d like to contribute to the analysis, get in touch.
The second looks at where value is migrating, what the market really needs, and what Distribution 2.0, free of legacy constraints, can achieve. The pathway to the next terminal era is becoming clear. We’ll aim to light it up and assess any challengers taking aim. If you’d like an early copy, drop me a line.
Long-form essays are occasional by necessity. The industry, though, evolves daily with challengers innovating at a frenetic pace. I want to build out two lighter-cadence formats to bridge the gap — and I’d like to know which you’d find more useful before I invest in either.
Niche player profiles: Short-form pieces on smaller, often overlooked players across the stack — fresh start-ups alongside long-term operators silently building for decades. The aim is texture: what innovation looks like in various niches, breaking down how and why they succeeded.
Industry signal and quick takes: A running analytical lens on stories worth paying attention to. Not adding to your news backlog but connecting dots across it - which trends matter, what patterns are revealed over time, and competitive implications.
Responding to this poll would help me prioritise my focus on a new bi-weekly output.
If this post gave you a new lens on something you’d been watching, or put a name to something you’ve felt but couldn’t articulate, leave a comment or like to let me know. Share this widely through your professional network to help others engage with ideas and concepts as you and I do. Set off a positive ripple effect to seed the change you want to see. Thanks for reading.
Cadastral registers are the official records of land parcels – their size, location, boundaries, value, and associated legal rights, maintained by government authorities and carrying legal force. Different from a title deed, which records encumbrances, restrictions and easements on ownership.
Evaluated pricing is standard practice across fixed income markets to mark to market illiquid bonds using a wide range of recently traded comparables. Many corporate bonds, municipal bonds, and structured products trade infrequently and are carried at evaluated rather than market prices at any given time. When those positions are eventually sold in a distressed market, the gap between the carried valuation and the actual clearing price can be substantial.
Financial Industry Regulatory Authority Trade Reporting and Compliance Engine. A mandated reporting system requiring broker-dealers to report over-the-counter fixed income transactions within 15 minutes of execution.
Concordance infrastructure maintains the mappings between the different identifier systems used to refer to the same instrument or entity across financial systems: a bond might carry an ISIN, a CUSIP, a SEDOL, and multiple proprietary vendor codes simultaneously, each used by different systems in the chain.
The highly contested space of exchange data distribution has arrived at nano-second latency and PCAP granularity, necessitating atomic clock precision, FPGAs for on-hardware data processing and ultra-high read/write speeds, which is both an unnecessary but unavoidable outcome of pure competition-led innovation
XBRL (eXtensible Business Reporting Language) is a standardised, machine-readable format for financial reporting data, mandated by the SEC for all public company filings.
Under Dodd-Frank, DTCC’s Trade Information Warehouse is the central node for credit derivatives. The US SDR regime concentrates swaps data more broadly, also through DTCC.
BGC Group, TP ICAP, and Tradition are three of the largest interdealer brokers by revenue, covering a broad cross-section of OTC instrument types. Their captive data platforms draw from transaction flow rather than licensed content, giving them a structurally independent sourcing position. The instruments covered across the three platforms span FX, interest rates, fixed income cash and derivatives, inflation, commodities, and structured products.
Cross-vendor resolution services resolve conflicts between the multiple identifier systems that describe the same financial instrument or legal entity across data providers — Bloomberg tickers, Refinitiv RICs, FDS CUSIPs, and internal firm codes. Security master utilities extend this to maintain the canonical, up-to-date record of every security a firm holds across all its systems.
A system of record is the designated authoritative platform for a particular domain of data or business process — the place where the canonical version of a record lives.
Thomson One and Reuters 3000 Xtra combined user counts from Thomson Reuters annual reports and investor presentations. LSEG count from 2025 Innovation Forum.
Activation and production players collectively enjoy better economics than Distribution. Broadridge has been included to show where a pure distribution player without any data assets and only workflows tracks. Originating data assets is unquestionably the source of industry economics, yet the fact still remains oddly contested in many boardrooms.
ICE data segment revenue (equities, FI, data & network): @$3bn ARR, 5.2% CAGR 2020–2025. Included here for scale; scope is broader than market-data-only and not directly comparable to the CME and TW figures above, which are market data only.
So good!!!
Love your stuff. Preliked this and will dig in.